138 Chapter 20 - Measurement Data Recording (DataGrabber)
106 V3.2
Note!
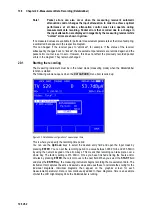
Packet errors can also occur when the measuring receiver's automatic
attenuation control changes the input attenuation. In order to achieve optimal
performance at all times, attenuation control must also operate during
measurement data recording. Packet errors that occurred due to a change in
the input attenuation are displayed in magenta by the measuring receiver while
“normal” errors are shown in yellow.
If no measured values are available for particular measurement parameters at the time of sampling,
a vertical red bar appears in the respective diagram.
This can happen if the receiver goes to “unlocked”, for example. If the status of the receiver
subsequently changes back to “locked”, the measurement parameters are recorded again and the
packet error counter is set to zero. However, this does not affect the previously recorded packet
errors in the diagram. They remain unchanged.
20.1
Starting the recording
The measuring instrument must be in the tuned mode (measuring mode) when the DataGrabber
function is started.
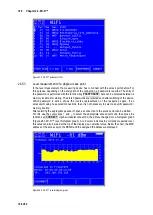
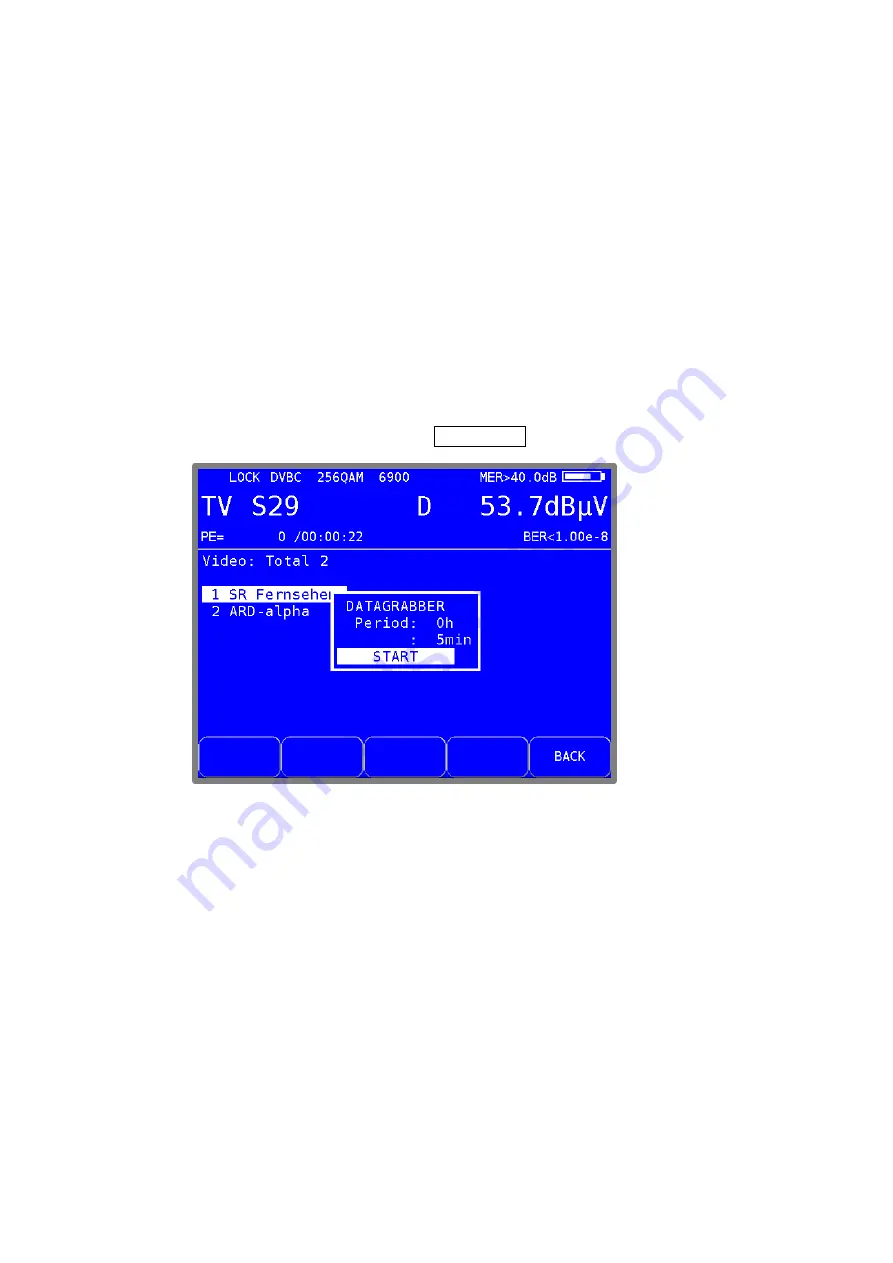
The following submenu opens when the
DATAGRABB.
menu item is called up:
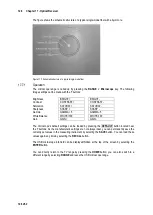
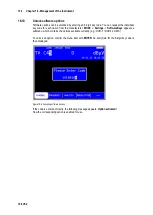
Figure 20-1 DataGrabber configuration of measurement time
This is where you specify the recording time period.
You can use the
Up
/
Down
keys to select the desired entry field and open the input mask by
pressing
ENTER
. You can set the recording period to a value between 00h 01min and 23h 59min
by using the numeric keypad or the arrow keys. This means that recording can take place over a
whole day. The factory setting is 01h 00min. Once you have finished entering the hours and/or
minutes by pressing
ENTER
, the cursor moves to the next field. When you select the
START
field
and press the
ENTER
key, the measuring instrument begins recording the measurement data. The
instrument first captures the active measured values and uses these to calculate the scaling for the
individual diagrams. Individual diagrams then appear on the graphics screen for each
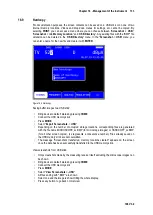
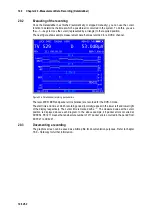
measurement parameter. Data is now continuously added to these diagrams. Here is an example
of what the LCD might display while the DataGrabber is running.

