p. 75
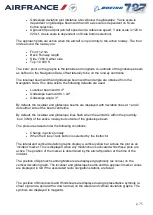
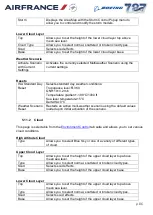
Glideslope deviation plot (distance above/below the glideslope; Y axis scale is
dependent on glideslope beam width and X axis scale is dependent on Scale
button selection)
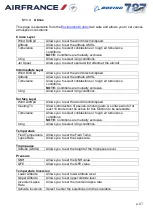
Approach Speed plot (aircraft speed and a reference speed; Y axis scale is 120 to
220 kt, X axis scale is dependent on Scale button selection).
The approach plots are active when the aircraft is in proximity to the active runway. The 'box'
limits around the runway are:
Front: 12 nm
Back: Runway length
Side: 7000 ft either side
Top: 10 000 ft
The 'zero' point on the graphs is the latitude and longitude co-ordinate of the glideslope beam
as defined in the Navigation Data, offset laterally to be on the runway centreline.
The localiser beam width and glideslope beam width and angle are obtained from the
Navigation Data. If no data exists, the following defaults are used:
Localiser beam width: 4º
Glideslope beam width: 1.44º
Glideslope angle: 3º
By default, the localiser and glideslope beams are displayed with deviation lines at 1 and 2
dots either side of the beam centreline.
By default, the localiser and glideslope lines flash when the aircraft is within the proximity
`box' (4Nm) of the active runway but outside of the glideslope beam.
The plots are erased under the following conditions:
Change in active runway
When the Erase Track button is selected by the instructor
The lateral and vertical deviation graphs display a vertical yellow bar across the plot as an
'incident' marker. This is displayed when any malfunction is activated while these plots are
active. The position of the marker is determined by the aircraft position at the time of the
incident.
The position of Approach Landing Markers are displayed graphically (as cones) on the
vertical deviation graph. The localiser and glideslope beams and the approach marker cones
are displayed in red if the associated radio navigation stations are failed.
The position of Microbursts and Windshears are displayed using representative symbols (a
shear sign and a spiral with a down arrow) on the lateral and vertical deviation graphs. The
symbols are displayed in magenta.


