119
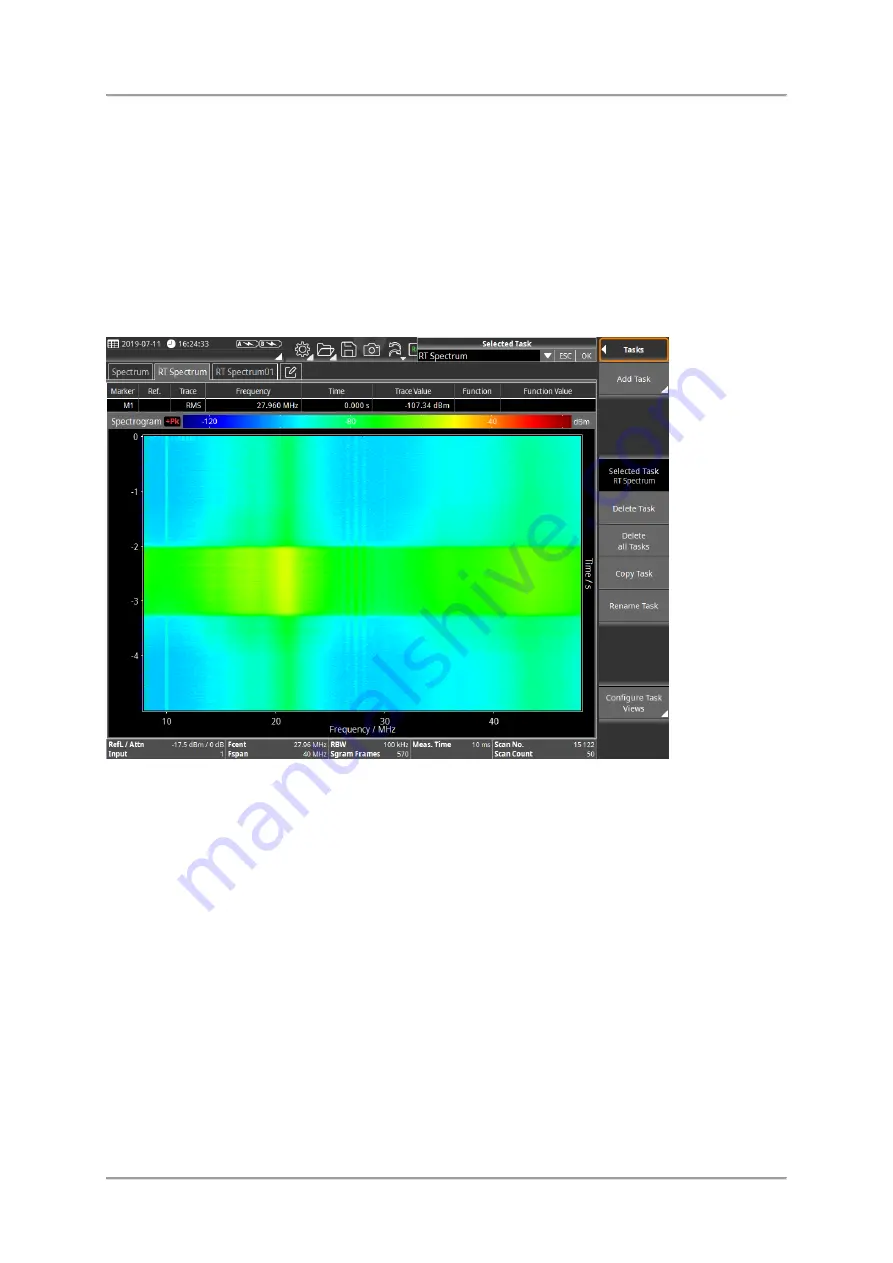
Spectrogram View
Spectrogram View
The spectrogram allows the display of the signal strength over time of a spectrum while
colors represent the signal level.
RMS
,
+Pk
and
-Pk
are available as detectors. Detectors compress the high-speed real time
spectra to the selected time resolution.
Available buttons
For information about the different types of buttons and how to select them see
Tap a button to change setting or to open the submenu.
Summary of Contents for Narda SignalShark
Page 1: ...User Manual Version 2019 07 ...
Page 2: ......
Page 14: ......
Page 15: ...15 Online Help Version 2019 07 ...
Page 16: ......
Page 31: ...Introduction 31 Figure Loop antenna frequency range 9 kHz to 30 MHz ...
Page 32: ......
Page 38: ......
Page 44: ......
Page 60: ......
Page 66: ......
Page 74: ......
Page 88: ......
Page 104: ......
Page 118: ......
Page 132: ......
Page 158: ......
Page 198: ......
Page 204: ......
Page 214: ......
Page 226: ......


