SignalShark User Manual
62
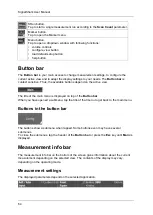
7 Button bar
The layout of the button bar is context sensitive and depends on the current view,
operation and selected function.
System information area
System information is displayed in the left panel of the upper status bar. Tapping the panel
opens the full menu.
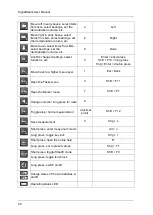
The displayed icons depend on the current running measurements and device status:
Shows the current date.
Shows the current time.
Shows the charge status of each of the batteries.
Shows that a view from the Data Logger.is displayed, and not a current
measurement.
Shows that the A/D converter is overdriven.
Shows that GNSS signal is being received.
Shows that the numbers are active on the numeric block. The Num key is lit in
blue.
Touchscreen function has been locked.
Due to too many active views no permanent real time calculation is possible.
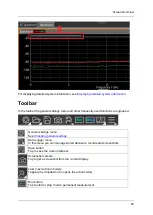
Progress bar
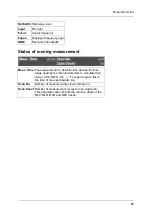
The progress of a measurement is displayed in the progress bar above the graph:
Summary of Contents for Narda SignalShark
Page 1: ...User Manual Version 2019 07 ...
Page 2: ......
Page 14: ......
Page 15: ...15 Online Help Version 2019 07 ...
Page 16: ......
Page 31: ...Introduction 31 Figure Loop antenna frequency range 9 kHz to 30 MHz ...
Page 32: ......
Page 38: ......
Page 44: ......
Page 60: ......
Page 66: ......
Page 74: ......
Page 88: ......
Page 104: ......
Page 118: ......
Page 132: ......
Page 158: ......
Page 198: ......
Page 204: ......
Page 214: ......
Page 226: ......

