La Crosse Technology, Ltd.
Page 8
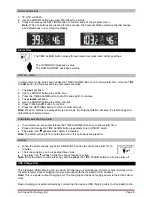
The icons forecast the weather in terms of getting better or worse and not necessarily sunny or rainy as
each icon indicates. For example, if the current weather is cloudy and the rainy icon is displayed, it does
not mean that the product is faulty because it is not raining. It simply means that the air pressure has
dropped and the weather is expected to get worse, but not necessarily rainy.
Common to weather forecasting, absolute accuracy cannot be guaranteed. The weather forecasting
feature is estimated to have an accuracy level of about 75% due to the varying areas the Forecast Station
has been designed for use. In areas that experience sudden changes in weather (for example from sunny
to rain), the Forecast Station will be more accurate compared to use in areas where the weather is
stagnant most of the time (for example mostly sunny).
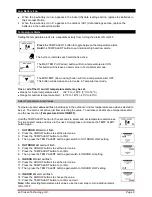
Forecast Trend Arrows
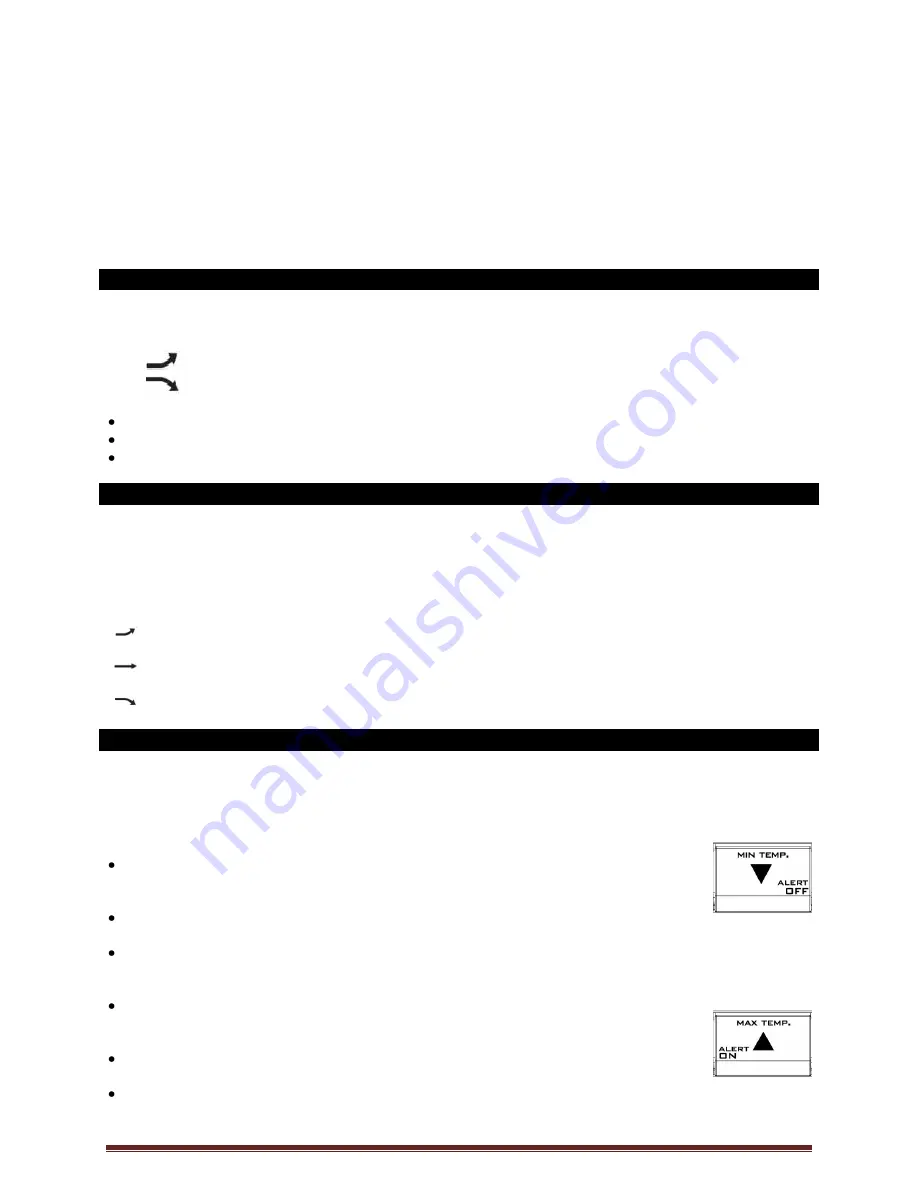
In the upper right corner of the forecast display, you can see forecast trend arrows that indicate the rising
or falling pressure trend.
Rising Pressure
Falling Pressure
The up trending arrow indicates the weather is improving.
The down trending arrow indicates the weather may worsen.
When there is no arrow, the pressure is steady.
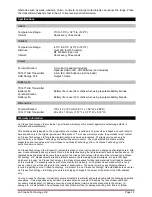
Temperature Trend Arrows
The indoor and outdoor temperature trend indicators will update every 30 minutes or less. These trends
represent temperature changes over the past three hours.
Example:
At 1:00pm, the arrow indicates the change in temperature since 10:00am. At 1:30pm, the
arrow will indicate the temperature change since 10:30am.
Temperature rose more than 2°F /1°C in the past three hours
Temperature has
not changed
more than 2°F /1°C in the past three hours.
Temperature fell more than 2°F /1°C in the past three hours
MIN/MAX Temperatures
The Forecast Station provides the daily minimum and maximum temperatures each day starting at
midnight (12:00 AM). The Forecast Station automatically resets the min/max temperatures at midnight
(12:00 AM).
View MIN data:
Press and release the MIN TEMP button to view the minimum Indoor and Outdoor
Temperatures.
Reset MIN data:
Hold the MIN TEMP button for five seconds and the Indoor and all Outdoor Minimum
Temperatures will be reset.
The temperature area will show dashes briefly then return to current temperatures.
View MAX data:
Press and release the MAX TEMP button to view the maximum Indoor and Outdoor
Temperatures.
Reset MAX data:
Hold the MAX TEMP button for five seconds and the Indoor and all Outdoor
Maximum Temperatures will be reset.
The temperature area will show dashes briefly then return to current temperatures.


