17
2.
The icons change in order, from “sunny” to “sun with clouds” to
“clouds with rain” or the reverse.
3.
It will not change from “sunny” directly to “clouds with rain”,
although it is possible for the change to occur quickly.
4.
If the symbols do not change, the weather has not changed (or the
change has been slow and gradual).
5.
The sensitivity of the change in foreacst icon is set by the user in
section F of the Detailed Set Up Guide.
F.
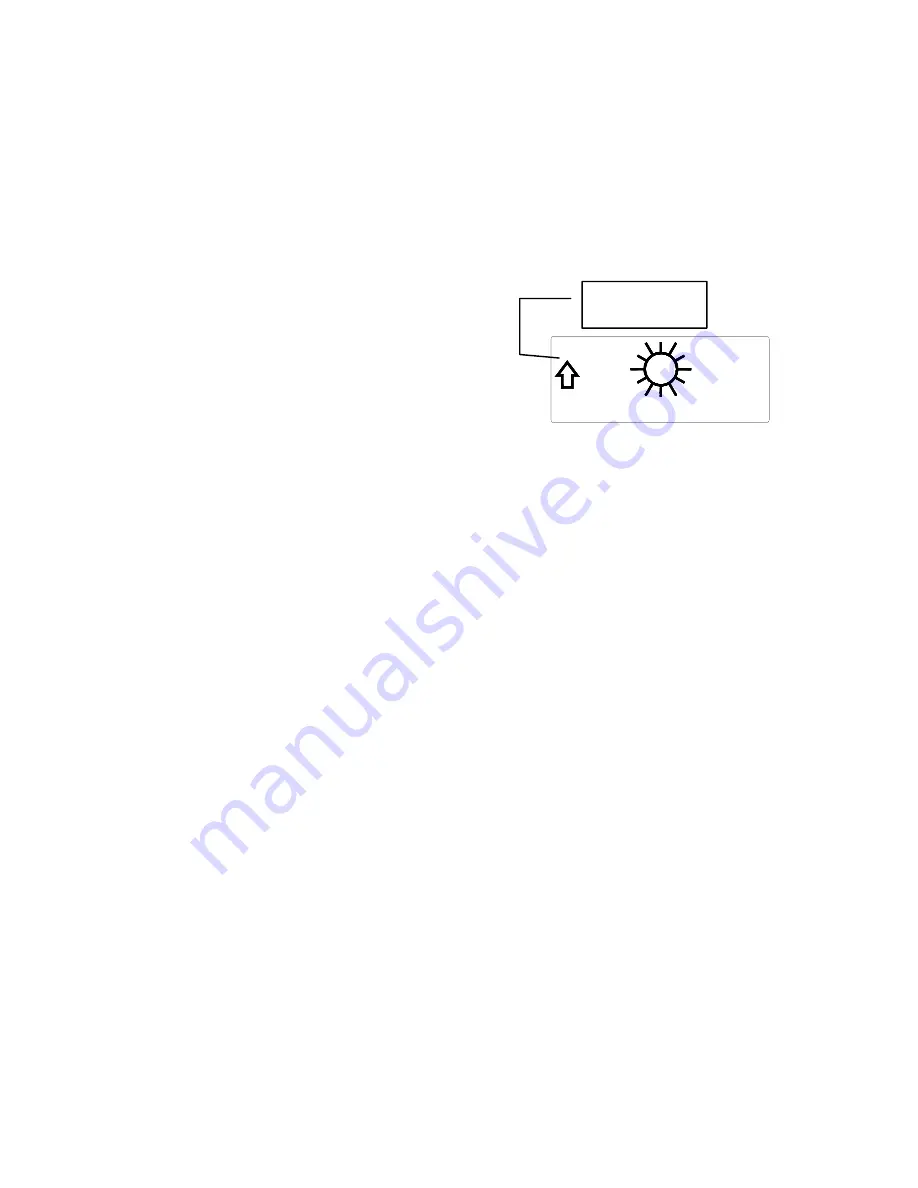
Weather Tendency Arrows
1.
Along with the forecast icon there
is a pressure tendency arrow.
2.
There is one that points up (on the
left side of the LCD) and one that
points down (on the right side of
the LCD).
3.
These arrows reflect current changes in the air pressure.
4.
An arrow pointing up indicates that the air pressure is increasing
and the weather is expected to improve or remain good.
5.
An arrow pointing down indicates that the air pressure is
decreasing and the weather is expected to become worse or remain
poor.
G.
Barometric Air Pressure Reading
1.
The actual barometric air pressure is displayed directly under the
weather forecast icon
2.
The relative air pressure is calibrated by the user through the
programming mode.
3.
Please Follow the programming instructions in section F of the
Detailed Set Up Guide to set this feature.
H.
Air Pressure History Bar Chart
1.
The bar chart indicates the air pressure history trend over the last
12 hours in 5 steps, 0h, -3h, -6h, -9h, and -12h.
2.
The “0h” represents the current full hour air pressure recording.
3.
The columns represent the “hPa” (0, ±2, ±4) at specific time.
4.
The “0” in the middle of this scale is equal to the current pressure
and each change (±2, ±4) represents how high or low in “hPa“ the
past pressure was compared to the current pressure.
5.
If the bars are rising, the weather is getting better due to the
increase of air pressure.
6.
If the bars go down, the air pressure has dropped and the weather is
expected to get worse from the present time “0h“.
Pressure trend
arrow


