background image

14

Menus:

File

Use this menu to call up, divide up or merge the weather data files, to print out
the various diagrams, to allocate sensor names, to define the specifications for
the display of single values and to export the measurements. In addition, you
also have the option of quitting the program.

Displays

The selection of desired sensors for graphical representation (e.g. rainfall, air
pressure, etc.) is made using this menu, where it is also possible to display all
sensor data at the same time. Furthermore, the measurements can be shown in
a weather display in the same way as with a weather station with an LCD. Here
the toolbar and the status bar can be switched on and off.

Weather display

Menu for the selection of different displays for displaying the weather as well as
for deleting the overall rainfall amount.

Interface

The manual or automatic readout of weather data according to a pre-set time
cycle is possible here. If desired, an automatic readout of the radio interface can
be produced each time the program is started. Furthermore, a readout of the
interface status can be made and the interface configured.

View

The display period for the available weather data as well as all parameters for
the graphical representation can be selected from this menu.

Window

Here a selection can be made defining whether several windows are to be shown
overlapping, adjacent to one another or on top of one another. Moreover, all
windows can be closed at the same time. In the lower part, all open windows
are listed. Either the currently active window is highlighted, or a window can be
activated from here.

Help

In the Help menu you can find the menu items “Help topics”, “Help” and “Info”.
Under “Help topics” and “Help” you will find the program’s online help, while
the program version is shown under “Info”.

Summary of Contents for WS-2510

Page 1: ...1 PC Radio Weather Station Operating and evaluation software for MS Windows 95 98 2000 NT ME XP Elektronik AG PF 1000 D 26787 Leer Phone 49 0 491 6008 88 Fax 49 0 491 6008 244 Operating instructions ...

Page 2: ... mechanical or chemical procedures without written permission of the publisher This handbook may contain mistakes and printing errors The information in this handbook is regularly checked and corrections made in the next issue We accept no liability for technical mistakes or printing errors or their consequences All trademarks and patents are acknowledged Printed in Hong Kong 44517 47754 V4 0 11 2...

Page 3: ...3 ...

Page 4: ... solar cells 24 Starting operation of the software and initialising the interface 25 Chapter 3 The File menu Selecting dividing adding a weather data file 29 Exporting 31 Printing 32 Page view 32 Printer set up 32 Sensor names 32 Preferences 33 Sliding mean value 33 Maximum change 34 Calibration of the rainfall sensor 34 Setting the absolute height 35 Setting the threshold value for sunshine durat...

Page 5: ...d 51 Time period forward 51 Time period back 51 Extend time period 52 Shorten time period 52 Matching time periods 52 Colour settings 52 Font 52 Settings 52 Chapter 8 The Window menu Overlapping 53 Adjacent 53 On top of one another 53 Arrange symbols 53 Close all 53 Chapter 9 The Help menu Help topics help info 54 Chapter 10 Buttons Toolbar 55 Appendix Appendix A Battery change 56 Appendix B Techn...

Page 6: ...range of up to 300 ft and thus allow full freedom and flexibility of installation The power supply to most of the sensors is provided by an integrated solar cell module A rechargeable battery provides power in the hours of darkness and periods of poor weather where there is relatively little sunlight For this reason maintenance of the sensors is generally not necessary except for battery powered s...

Page 7: ... Help Buttons can be operated via either the mouse or the keyboard Input field As the name suggests an input field allows the input of characters Depending on the type of input field it may be possible to input any character or e g only digits Check box A check box allows a function to be switched on and off The current status is indicated by a cross or a tick Selection field This operating compon...

Page 8: ...following buttons OK This button is used to close the current window Input and settings are then saved Cancel This button also causes the current window to close Input and settings are then however not saved Close This button is used to close the current window In contrast to the OK button this button appears in those windows where no settings can be made Help Pressing this button opens the releva...

Page 9: ...9 Chapter 1 Introduction ...

Page 10: ... use in other programs or printed out Weather data can be displayed e g in the form of a diagram and a table The minimum and maximum values for the selected time period are also displayed The measurements can if desired also be displayed in a separate window which matches the display of a standard weather station and which will allow a quick overview of all current values This software supports th...

Page 11: ...play of the air pressure for the past 72 hours Symbolic indication of the weather forecast rainy cloudy bright sunny only weather display In the weather display you can see the weather forecast in the form of clear easy to understand symbols Display of hours of sunshine The threshold for detecting sunshine is adjustable Storage and display of the minimum and maximum hours per day with the time dat...

Page 12: ...ating system your PC should have at least 32 MB working memory For printouts any printer compatible with Windows is suitable Use of an inkjet printer or a laser printer allows professional printouts to be created without difficulty Installation The operating and evaluation software for the weather station is installed by calling up the Install installation program on the program CD This can for ex...

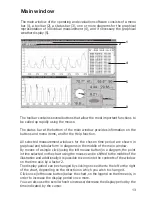
Page 13: ...e period are shown in graphical and tabular form in diagrams in the middle of the main window By means of a single click using the left mouse button in a diagram the point in time selected on the chart using the mouse can be shifted to the middle of the illustration and additionally it is possible to zoom into the contents of the window on the time axis by a factor 2 The display period can be chan...

Page 14: ...erall rainfall amount Interface The manual or automatic readout of weather data according to a pre set time cycle is possible here If desired an automatic readout of the radio interface can be produced each time the program is started Furthermore a readout of the interface status can be made and the interface configured View The display period for the available weather data as well as all paramete...

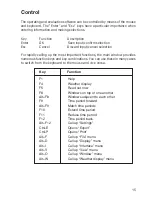
Page 15: ...function keys and key combinations You can use these in many cases to switch from the keyboard to the mouse and vice versa Key Function F1 Help F4 Weather display F5 Read out now F8 Windows on top of one another Alt F8 Windows adjacent to each other F9 Time period forward Alt F9 Match time periods F10 Extend time period F11 Reduce time period F12 Time period back Alt F12 Call up Settings Ctrl E Op...

Page 16: ...16 ...

Page 17: ...17 Chapter 2 Starting operation ...

Page 18: ...the sensors are in test mode for up to 10 minutes after introduction of the operating voltage either by placing magnets in the outdoor sensors or placing batteries in the interior sensors During the test phase the data transfer takes place not every 3 minutes but instead in a 4 second cycle Clear addresses must also be allocated to the outdoor sensors for collecting temperature and humidity data s...

Page 19: ...version 1 1 Depending on the type and the period of manufacture the S 2000 system sensors are supplied in two software versions see print sticker on the sensor or the packaging The weather station is always set to version 1 2 after com missioning If you are using version 1 1 sensors signals from these will not initially be received However as the weather station can add new sensors to its sensor a...

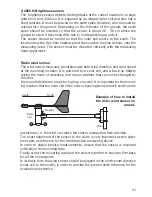
Page 20: ...dity sensors that transmit up to 8 different temperature humidity values Each one of these sensors can appear in the software under its own name e g named after the location of the sensor For this the sensors must have a clear address allocated to them which at the same time indicates their position in the request order For these types be sure to observe the instructions for addressing Every senso...

Page 21: ...he mounting location It is powered by a solar cell and a back up battery during the hours of darkness and has an address that cannot be changed by the user It is mounted either on a mast or high up on a wall It is important for the mount ing location that the solar cell in the sensor housing faces directly south and is Example of how to install the radio wind sensor on a mast unshielded i e the wi...

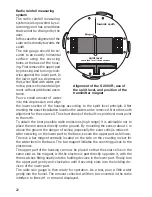
Page 22: ...igh range it is advisable not to place the rain sensor directly on the ground By mounting the sensor about 1 m above the ground the danger of soiling especially the solar cells is reduced After screwing on the lower part to the base secure the upper part as follows There is a bar magnet centrally located on the side on the counting rocker for the water level in the base The bar magnet initiates th...

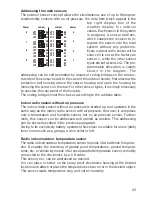
Page 23: ...r radio sensor without air pressure is started up and operates in the same way as the indoor radio sensor with air pressure However it comprises only a temperature and humidity sensor but no air pressure sensor Further more this sensor can be addressed and named as desired This addressing can be set as described in the previous paragraph Owing to its exclusively battery operation this sensor is su...

Page 24: ... provided Position the sensor on the wall bracket and screw the two parts together using the screw provided When doing this the large protective bell housing must be at the top and the solar cell must be pointing towards the light During the hours of darkness and periods of bad weather with relatively little sunlight an indoor battery system which is charged by the solar cell during periods of sun...

Page 25: ...hapter 6 Interface 2 Initialisation After the batteries have been inserted and the interface s internal initialisation phase is over the interface will be set to the following standard parameters Address of the indoor sensor 7 Address of the wind sensor 7 Address of the brightness sensor 7 Address of the rain sensor 7 Sensor version 1 2 Interval time 5 minutes If you wish to change these parameter...

Page 26: ...o the PC for approximately 6 minutes since during this time all sensors present are automatically identified 3 Additional settings For the correct air pressure to be displayed it is essential to define the height of the location in metres above sea level Here the absolute height above sea level must be entered in the corresponding input field in the software in the File Specifications Air pressure...

Page 27: ...27 Then the desired all received sensors are shown as charts on the program s display For detailed program settings please read the chapters relating to the individu al program menus ...

Page 28: ...28 Chapter 3 File menu ...

Page 29: ...appears answer the question should the file be created by clicking on Yes The empty program display field will then appear and you can highlight the desired sensor s via the Display Sensor management menu and display them by using the display selector Then once the new file has been created the user will be asked which files are to be loaded from the radio interface If so far no data have been col...

Page 30: ...30 Append This option allows you to add an already saved file to the current file Both files are displayed in an interrelated form the next time the sensor display is called up ...

Page 31: ...or To divide up the individual data date time measurement you will for many formats require a special separator to ensure that the data can be correctly read by other programs Often a semicolon will be required The data are exported in ASCII format Unicode meaning that the file can be imported into all available word processing layout and statistics programs etc The weather figures always appear w...

Page 32: ...s particularly suitable see above You can export the data to e g Excel as described under Export and then print out an Excel table Print preview This function shows the complete view of the page to be printed according to the parameters selected under Print Setup Print Setup This menu item allows you to select the desired printer which should be used for printing Moreover the characteristics of th...

Page 33: ...luctuations freak values in the graphical representation of temperature humidity and in air pressure diagrams In this way a sliding mean value is created for a selectable number of measurements If for example a sliding mean of 10 is entered in the input field then the current measurement as well as the 10 previous and 10 subsequent values will be taken for the creation of mean values Thus the mean...

Page 34: ...ured very slowly into the funnel of the rainfall sensor CAUTION Pouring quickly will falsify the measurement result Slowly pour the water into the funnel so that water is at no time resting in the funnel Due to the funnel diameter i e 130 mm or 0 0133 m2 surface area 100 ml of water must give a rainfall target value of 7 5 l m2 After all of the water has run through you should wait approximately 1...

Page 35: ...as sunshine This threshold can be set between 2 and 99 klux and is set in the factory to 20 klux A value above the value set is judged to signify sunshine This value corresponds to the threshold value generally used in meteorology for registering the hours of sunshine The sunshine duration transmitted from the brightness sensor is used if the threshold level is 20 klx For all other values the prog...

Page 36: ...36 Chapter 4 Display menu ...

Page 37: ...ed in the input fields arranged in this part There are eight pre set options ranging from the last hour to the last 30 days Furthermore the entire data collection period can automatically be displayed Of course data can only be loaded according to the time period displayed above The pre set time periods allow a more rapid operation as it is often unnecessary to input concrete time data Graphical a...

Page 38: ... fills the entire screen Temperature humidity Menu for selecting the temperature humidity sensor to be shown in the display After selecting the corresponding sensor the window for the display period appears Once you have selected this the graph table is shown The display possibilities for the measurements Here a full image representation for temperature and air humidity are shown with a split disp...

Page 39: ...h the corresponding minimum and maximum values Hours of sunshine Display of sunshine duration as a column diagram provided that the threshold value set for the sunshine duration is exceeded The scaling is adapted as the sunshine duration increases and after sunset a long cloudy period this is shown cumulatively for the day The values table too constantly shows the individual values obtained for su...

Page 40: ...in order to change the properties of the window see chapter 5 Weather display e g to choose which of the outdoor sensors is to be displayed The settings for the window are saved automatically meaning that when it is next called up the window appears with the properties that were last selected for it The display fields for the weather display are permanently allocated Top left Indoor sensor with te...

Page 41: ...e Help facility etc By hiding the status bar you can increase the size of the diagram The numerical measurement display in the measurement display window activated by the cursor with date and time shown within the status bar is particularly convenient In this way for any position selected with the cursor arrow inside the graph the respective valid measurement values e g temperature and humidity ar...

Page 42: ...42 Chapter 5 Weather display menu ...

Page 43: ... can be selected via this menu In the right display field up to 8 sensors can be supported Here it is of course only possible to select those sensors which are actually present Rainfall display This menu allows you to select whether the total rainfall the rainfall for the past hour from half past the last hour to half past the current hour or the rainfall for the past day data collection time from...

Page 44: ...44 Chapter 6 Interface menu ...

Page 45: ...dow appears showing the status of all sensors In the status window of the radio interface the number of sensors supported the time interval set for storage of the measurement values and the current reception status of the individual sensors are shown Isolated reception failures in individu al sensors are normal and are generally caused by 2 sensors in the same time window Due to transmission inter...

Page 46: ...rface will be set to the following standard parameters Address of the indoor sensor 7 Address of the wind sensor 7 Address of the brightness sensor 7 Address of the rain sensor 7 Sensor version 1 2 Interval time 5 minutes If you wish to change these parameters you should select the Initialisation option Here you can define the addresses of the above sensors as well as the sensor version and the in...

Page 47: ...s in the initialisation window the radio interface is re initialised If this is the case all previously saved weather data will be lost Before the change is made you will first be asked if you are sure In case of doubt you should make a readout of the available weather data before switching over Also the radio interface cannot transmit any data to the PC for approximately 6 minutes since during th...

Page 48: ...al interfaces per PC COM port In the case of the RS232 multiplexer available the selection of the internet address is made via this menu item If you use the ELV RS 232 multiplexer first set the option Available marked with a tick when activated and then the multiplexer port occupied by the radio interface If a second multiplexer is cascaded the option Two stage and the correspond ing ports on both...

Page 49: ...49 ...

Page 50: ...50 Chapter 7 View menu ...

Page 51: ...period automatically Of course data can only be loaded according to the time period displayed above The pre set time periods allow a more rapid operation as it is often unnecessary to input concrete time data Period forward If only a part of the display period is shown in the graph this function can be used to move the area of the chart displayed on the screen in a forward direction Period backwar...

Page 52: ...opens up a window in which you can change the font font style and font size This same font will be used by the program when printing or displaying text on the screen Settings Use the menu item Settings to change the scaling of the display of the window currently open As well as freely adjustable minimum and maximum values the scaling can also be matched to the minimum and maximum values of the dis...

Page 53: ...rizonally Up to 3 measurement windows are shown on the screen on top of one another while further open system windows are automatically arranged adjacent to one another Arrange icons All minimised measurement windows will be arranged automatically along the bottom edge of the screen Close all All open measurement windows are closed simultaneously In the lower part of the menu all currently open wi...

Page 54: ... and words Help In this way you can reach the table of contents for the online help By clicking on your desired chapter you open the text window for that topic Contents button This button takes you back from a help topic to the table of contents Index button This button brings you to the selection of key words help topics Back button This button takes you back either to the table of contents or to...

Page 55: ...a reads off weather data immediately from the interface Time period back shifts the time period backwards Set time points determines the start and end points date time of the display Time forward shifts the time period forward Extend time period extends the time period displayed Shorten time period shortens the time period displayed Printing Info Read off weather data Time period back Time period ...

Page 56: ...is sensor must appear again no later that after the radio interface has made its rotational sensor search see Appendix C Interference PC radio interface weather station If communication between the radio interface and the PC is no longer flowing smoothly or the reception is blocked from a number of sensors it can be in ferred that the batteries in the radio interface are exhausted A description of...

Page 57: ...Air pressure trends Calculated from developments in air pressure values over the past few hours The calculation takes place according to the following pattern Air pressure rises more than 2 hPa in 3 hours increasingly strongly Air pressure rises more than 2 hPa in 6 hours normal increase Air pressure drops more than 2 hPa in 6 hours normal drop Air pressure drops more than 2 hPa in 3 hours falling...

Page 58: ...ow mean sea level or by entering directly the height of the location above sea level Wind strength table Beaufort Beaufort Wind speed Description 0 0 0 7 km h calm 1 0 7 5 4 km h slight breeze 2 5 5 11 9 km h light breeze 3 12 0 19 4 km h weak breeze 4 19 5 28 5 km h moderate breeze 5 28 6 38 7 km h fresh breeze 6 38 8 49 8 km h strong wind 7 49 9 61 7 km h stiff wind 8 61 8 74 6 km h stormy wind ...

Page 59: ...lay No reception the distance between transmitter and receiver is too great Reduce the distance between the transmitter and the receiver Repeater for range increase Ranges that are reduced by building parameters can be compensated for by a special repeater developed for weather stations The battery driven repeater equipped with transmitter and receiver receives the data of the desired sensors and ...

Page 60: ...uency A measure such as this effectively cuts out interference A radio sensor interferes with other devices in the 433 MHz range The transmissions from a radio sensor can interfere with other devices on the same channel for a short period every 3 minutes for about 200 ms This interference lasts only a very short time and thus can be ignored If possible the channel should be changed on the device R...

Page 61: ...n the transfer characteristics and therefore the range Wide band interference in built up areas can reach levels that reduce the signal noise ratio throughout the frequency band which reduces the range Devices with adjacent working frequencies can also influence the receiver Badly shielded PCs can irradiate the receiver and limit its range Repeater for range increase Ranges that are reduced by bui...

Page 62: ...ange 800 to 1 100 hPa 23 62 to 32 48 inHg Resolution 1 hPa 0 03 inHg Accuracy 1 hPa 0 03 inHg Rainfall 0 to 9 999 mm 0 to 393 66 in Resolution 0 5 mm 0 02 in Accuracy 2 1 mm 2 0 04 in Wind speed 0 to 200 km h 0 to 124 3 mph Resolution 0 1 km h 0 1 mph Accuracy 3 1 km h 3 0 6 mph Wind direction Numerical resolution 5 degrees Brightness display 0 to 200 000 lux Resolution up to 1 klux 1 lux up to 10...

Page 63: ...ccessive data records follow this as they are received from the interface Structure of the data record struct WSPC_DATA time_t zeit WSPC_TEMP_FEUCHTE temp 9 8 Temp humidity sensor WSPC_DRUCK druck Pressure sensor WSPC_WIND wind Wind sensor WSPC_REGEN regen Rain sensor WSPC_HELL_PYR helligkeit Brightness sensor WSPC_HELL_PYR pyrano Pyranometer pragma pack 1 all the following data are byte aligned s...

Page 64: ...g data from the rain sensor struct WSPC_BRIGHTNESS_PYR int wert unsigned char flag structure for recording data from the brightness sensor Data transfer from the interface to the PC Overview of commands 0 Activate communication 1 Request time 2 Select first saved data record 3 Select next data record 4 Request data record 5 Request status D Initialise interface interval time sensor addresses and s...

Page 65: ... oscillator is running smoothly and commands can be properly received Once the interface has responded to the activation command the data transfer can begin The data exchange via the V24 interface has priority over reception from the sensors Thus the reception of data should take place over longer intervals Data records are therefore also only deleted after a special request from the PC By compari...

Page 66: ...hile the end symbol will be ETX All symbols between the start and the end will be processed in such a way that no STX and no ETX occur STX becomes the symbol series ENQ DC2 ETX becomes the symbol series ENQ DC3 ENQ becomes the symbol series ENQ NAK After a data package has been received this editing must first be cancelled before the length and the test total can be checked From the length you can...

Page 67: ...sec 1 byte second binary Day 1 byte day in BCD one b0 3 ten b4 7 month 1 byte b0 b3 month binary b4 b6 day of the week Select next data record SOH 2 total EOT This command serves to raise the ring pointer on the data records in the interface After a data record has been requested the pointer is not automatically raised because it cannot recognise whether the data have been properly processed by th...

Page 68: ...d SOH 4 total EOT Response from the interface 36 byte 1 no data available DLE 2 data available block number Lo block number Hi time Lo time Hi 32 byte data record Block number Number of the block in the memory not connected to time Monitors whether data records are transferred twice Time Current age of the data record in minutes Data Data record 32 bytes ...

Page 69: ...then the humidity value is invalid sensor has no humidity L1 Temp 1 in C b3 b0 0 1 0 9 H1 Temp 1 in C b7 b4 1 0 9 L2 Temp 1 in C b2 b0 10 0 7 b3 Sign H2 Humidity 1 in b7 b4 1 0 9 if value 9 sensor has no humidity L3 Humidity 1 in b2 b0 10 2 0 7 b3 New flag H3 Temp 2 in C b7 b4 0 1 0 9 L4 Temp 2 in C b3 b0 1 0 9 H4 Temp 2 in C b6 b4 10 0 7 b7 Sign L5 Humidity 2 in b3 b0 1 0 9 if value 9 sensor has ...

Page 70: ... b0 1 0 9 H14 Temp 6 in C b6 b4 10 0 7 b7 Sign L15 Humidity 6 in b3 b0 1 0 9 if value 9 sensor has no humidity H15 Humidity 6 in b6 b4 10 2 0 7 b7 New flag L16 Temp 7 in C b3 b0 0 1 0 9 H16 Temp 7 in C b7 b4 1 0 9 L17 Temp 7 in C b2 b0 10 0 7 b3 Sign H17 Humidity 7 in b7 b4 1 0 9 if value 9 sensor has no humidity L18 Humidity 7 in b2 b0 10 2 0 7 b3 New flag H18 Temp 8 in C b7 b4 0 1 0 9 L19 Temp 8...

Page 71: ... is transferred with a resolution of 5 where the bottom bit in the first nibble represents the 5 value Both of the upper bits of the 100 nibble give the range of fluctuation of the wind direction 0 22 5 45 67 5 L22 Wind in km h b3 b0 0 1 0 9 H22 Wind in km h b7 b4 1 0 9 L23 Wind in km h b3 b0 10 0 15 max 159 9 km h H23 Direction in b7 b4 10 0 9 L24 Direction in b1 b0 100 0 3 b3 b2 Fluctuation rang...

Page 72: ... 999 and a 2 bit factor 1 10 100 1000 in 1 10 W m This yields a range of values from 0 to 99 900 0 W m L31 Effect in W m b3 b0 1 0 9 H31 Effect in W m b7 b4 10 0 9 L32 Effect in W m b3 b0 100 0 9 H32 Factor b5 b4 Factor 0 1 1 10 2 100 3 1000 b7 New flag The new flag reveals whether the sensor data has been received again in the time period between the reception of this data record and of the last ...

Page 73: ...ddress 0 7 B8 B18 B0 B2 Pyranometer sensor address 0 7 B3 B4 B6 Brightness sensor address 0 7 B8 Status of sensors 16 unavailable 16 OK 17 255 Reception interference quantity 16 Interface init SOH D interval V wind rain V brightn pyrano V indoor version total EOT The interface is re initialised In this way the interval time the sensor addresses and the protocol version are re set Then the interfac...

Page 74: ...Brightness sensor and pyranometer address B0 B2 Pyranometer address 0 7 B3 free B4 B6 Brightness sensor address 0 7 B8 always 1 V indoor version Indoor sensor and protocol version addresses B0 0 Protocol V1 2 1 Protocol V1 1 B1 B3 free B4 B6 Indoor sensor address 0 7 B8 always 1 Response from the interface 1 byte ACK format_wdat format_interf ...

Page 75: ...75 ...

Reviews: