background image


12

D.


COMFORT LEVEL INDICATOR 
 

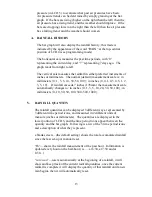
The comfort level indicator appears in the center portion of LCD 2 
(between the Indoor temperature and the Indoor humidity) as either a 
“happy-face” or as a “sad-face”.  The indicator will display a “happy-
face” when the temperature is between 68

°

F and 79

°

F (20

°

C and 

25.9

°

C), and the humidity is between 45% and 64%.  A “sad-face” will 

be displayed when the temperature and humidity are outside the 
mentioned ranges. 


If the humidity is below 45% the word “DRY” will appear to the right 
of the “happy-face” icon.  If the humidity is above 54% the word “wet” 
will appear to the right of the “sad-face” icon. 


IV.


BAR GRAPH HISTORIES 
 

A.


AIR PRESSURE HISTORY 
 

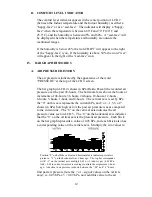
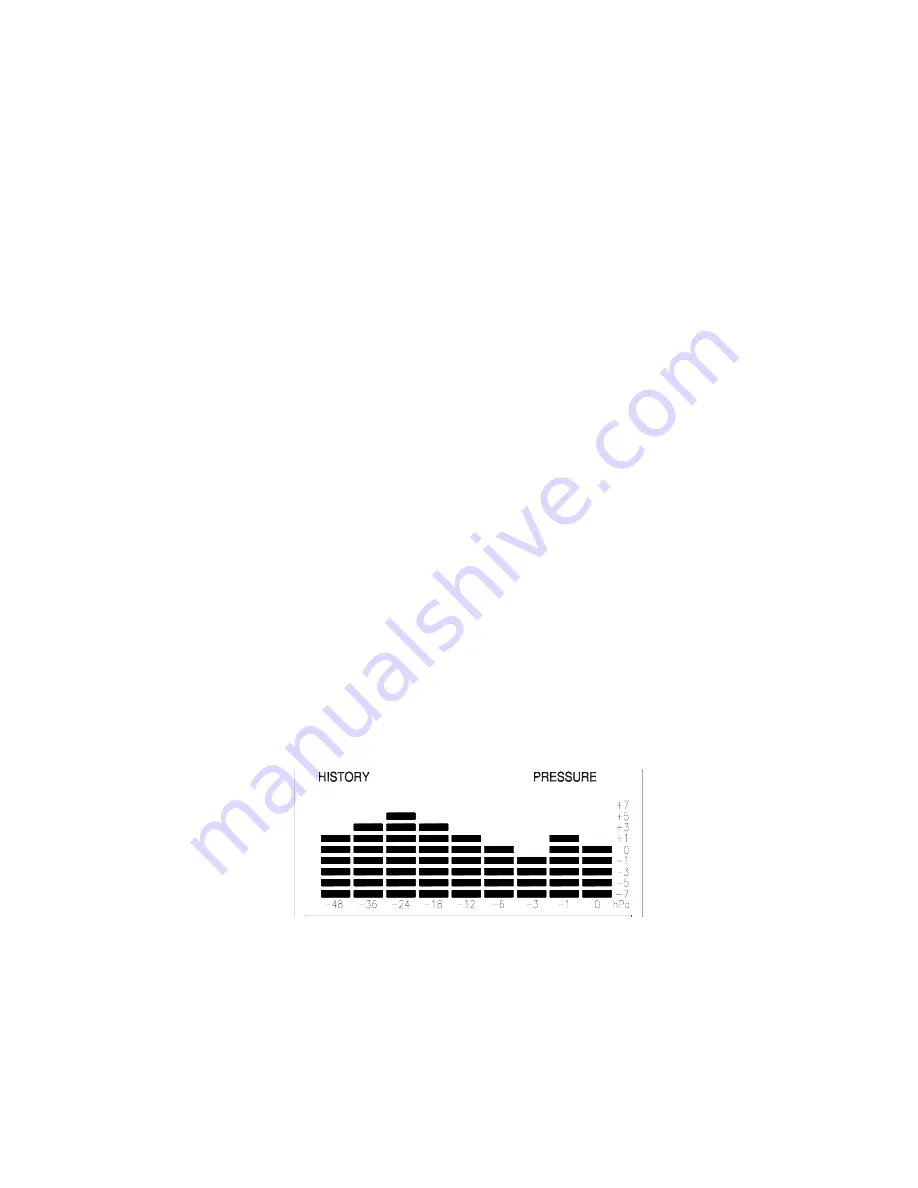
The air pressure is indicated by the appearance of the word 
“PRESSURE” at the top of the LCD 4 screen. 
 
The bar graph (in LCD 4) shows in hPa (Hekto Pascal) the recorded air 
pressure over the past 48-hours.  The horizontal axis shows the hours at 
increments of 48-hours, 36-hours, 24-hours, 18-hours, 12-hours, 
6-hours, 3-hours, 1-hour, and 0-hours.  The vertical axis is set by hPa:  
the “0” on this axis represents the current hPa, and + or – 1,3,5, or 7 
shows (in hPa) how high or low the past air pressure was as compared 
to the current one.  The “0” on the vertical axis indicates the air 
pressure value seen in LCD 5.  The “0” on the horizontal axis indicates 
that the “0” on the vertical axis is the present air pressure.  Each brick 
on the bar graph represents a value of 0.03 hPa, and each brick also has 
a corresponding value on the verticle axis.  Multiply the two values to 

find past air pressure (note the + or – sign of values on the verticle 
axis); i.e. 0.03 hPa x 3 = 0.09 hPa, now add this value to the air 

Position “0” on both the vertical and horizontal axis indicates present air 
pressure.  “-1” on the horizontal was 1-hour ago.  The top bar corresponds 
with “+1” on the vertical axis, multiply 0.03 x (+1) and we get +0.03 hPa.  
Add +0.03 to current air pressure readings to attain the air pressure 1-hour 
ago.  A decline in air pressure is shown between the “-24” and “-3” hours.    

Summary of Contents for WS-7058U

Page 1: ...WS 7058U Wireless 433 MHz Wireless Weather Center Instruction Manual...

Page 2: ...ty 8 Displaying Relative Absolute hPa inHg 8 9 Manually Setting Relative Air Pressure 9 Setting Bar Graph Display 9 Features Operations Viewing Date or Time 9 Minimum Maximum Records Indoor Outdoor Re...

Page 3: ...card ADDITIONAL EQUIPMENT not included 1 Seven fresh 1 5V AA batteries 2 Philips screwdriver 3 Flathead screwdriver 4 Four wall mounting screws QUICK SET UP GUIDE 1 Insert two AA batteries into the R...

Page 4: ...bracket Press the arrow and slide the battery cover off 3 Observing the correct polarity install 2 AA batteries 4 Replace battery cover and place rain cover snugly onto the sensor B RAINFALL SENSOR 1...

Page 5: ...lso a satellite icon that appears between the Outdoor temperature and humidity this icon informs the user that the Weather Center is receiving signals from the sensors Within 12 minutes the Outdoor te...

Page 6: ...Press the button to advance through the LCD settings There are 8 settings to select from LCD 0 is the lightest and LCD 7 is the darkest 3 Press the SET button to confirm and to advance to select 12 2...

Page 7: ...e year Note The date is displayed in the Day Month Year format 4 Press the SET button to confirm the year and to advance to set the month The default month digit 1 will flash in LCD 1 5 Press the butt...

Page 8: ...hPa inHg OR ABSOLUTE hPa inHg Note Air pressure can be displayed in four different measures Relative hPa inHg and Absolute hPa inHg Absolute settings give a true and real time air pressure reading at...

Page 9: ...the Rain History and the Air Pressure History the default setting 1 Press the SET button thirteen times to enter the Bar Graph Display Setting 2 The bar graph in LCD 5 will flash alternating between t...

Page 10: ...The minimum temperature in LCD 6 shifts to the recorded maximum temperature with the recorded time in LCD 1 Press the OUTDOOR button a fourth time to view the recorded date Press the OUTDOOR button t...

Page 11: ...e change has been slow and gradual B WEATHER TENDENCY ARROWS LCD 3 also displays the weather tendency arrows One arrow points up and one arrow points down both arrows appear on the left hand side of L...

Page 12: ...at increments of 48 hours 36 hours 24 hours 18 hours 12 hours 6 hours 3 hours 1 hour and 0 hours The vertical axis is set by hPa the 0 on this axis represents the current hPa and or 1 3 5 or 7 shows...

Page 13: ...in inches 0 0 1 0 3 0 5 1 2 3 5 10 If rainfall exceeds 7 inches 178mm the measurement scale automatically changes to in inches 0 1 3 5 10 20 30 50 100 in millimeters 0 10 30 50 100 300 500 1000 V RAIN...

Page 14: ...SETTING OF THE RAIN MULTIPLICATOR Note The rain multiplicator is the height of rain held in the teeter totter bucket inside the rain gauge before it is tipped It is preset to a value of 3 75 tips per...

Page 15: ...SET button two times The 3 should flash 5 Hold the SET button down until the air pressure in hPa briefly flashes in LCD 5 LCD 5 will flash in LCD 2 for 15 seconds 6 Do not press any buttons while the...

Page 16: ...r Center B SELECTING WHICH SENSOR DATA TO DISPLAY 1 To view the outdoor temperature and humidity from a different sensor press the button A shift from a boxed 1 to a boxed 2 should be observed under t...

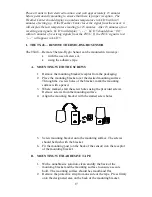
Page 17: ...TING WITH THE SCREWS 1 Remove the mounting bracket receptor from the packaging 2 Place the mounting bracket over the desired mounting surface Through the 2 screw holes of the bracket mark the mounting...

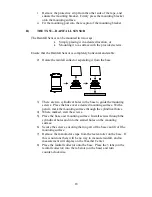
Page 18: ...l holes in the base to guide the mounting screws Place the base over a desired mounting surface With a pencil mark the mounting surface through the cylindrical holes 4 Where marked start the screws 5...

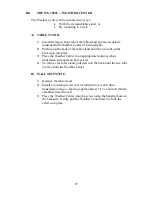
Page 19: ...into place 3 Place the Weather Center in an appropriate location where transmission signals can be received 4 To remove the table stand pull down on the back until the two tabs are free from the Weath...

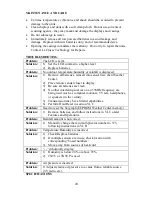
Page 20: ...der closer to display 3 Be sure all batteries are fresh 4 No other interfering sources on a 433MHz frequency are being used such as computer monitors TV sets headphones or speakers in the vicinity 5 T...

Page 21: ...lative inHg adjustable 28 60 inHg to 30 45 inHg Sensitivity setting hPa 1 hPa to 4 hPa Air pressure history For the past484 hours 0 1 3 6 12 18 24 36 and 48 Rainfall measurements Rain quantity display...

Page 22: ...ain quantity Transmission frequency 433 92 MHz Transmission range 80 feet 25m Power supply Weather Center 3 x AA IEC LR14 1 5V batteries Thermo Hygro Sensor 2 x AA IEC LR6 1 5V batteries Rain gauge 2...

Page 23: ...owner must pay any shipping charges incurred in getting your La Crosse Technology Ltd product to a La Crosse Technology Ltd authorized service center La Crosse Technology Ltd will pay ground return sh...

Page 24: ...gy 2809 Losey Blvd S La Crosse WI 54601 Phone 608 782 1610 Fax 608 796 1020 e mail support lacrossetechnology com warranty work sales lacrossetechnology com information on other products web www lacro...

Reviews: