29
INDOOR RELATIVE HUMIDITY AND INDOOR TEMPERATURE:
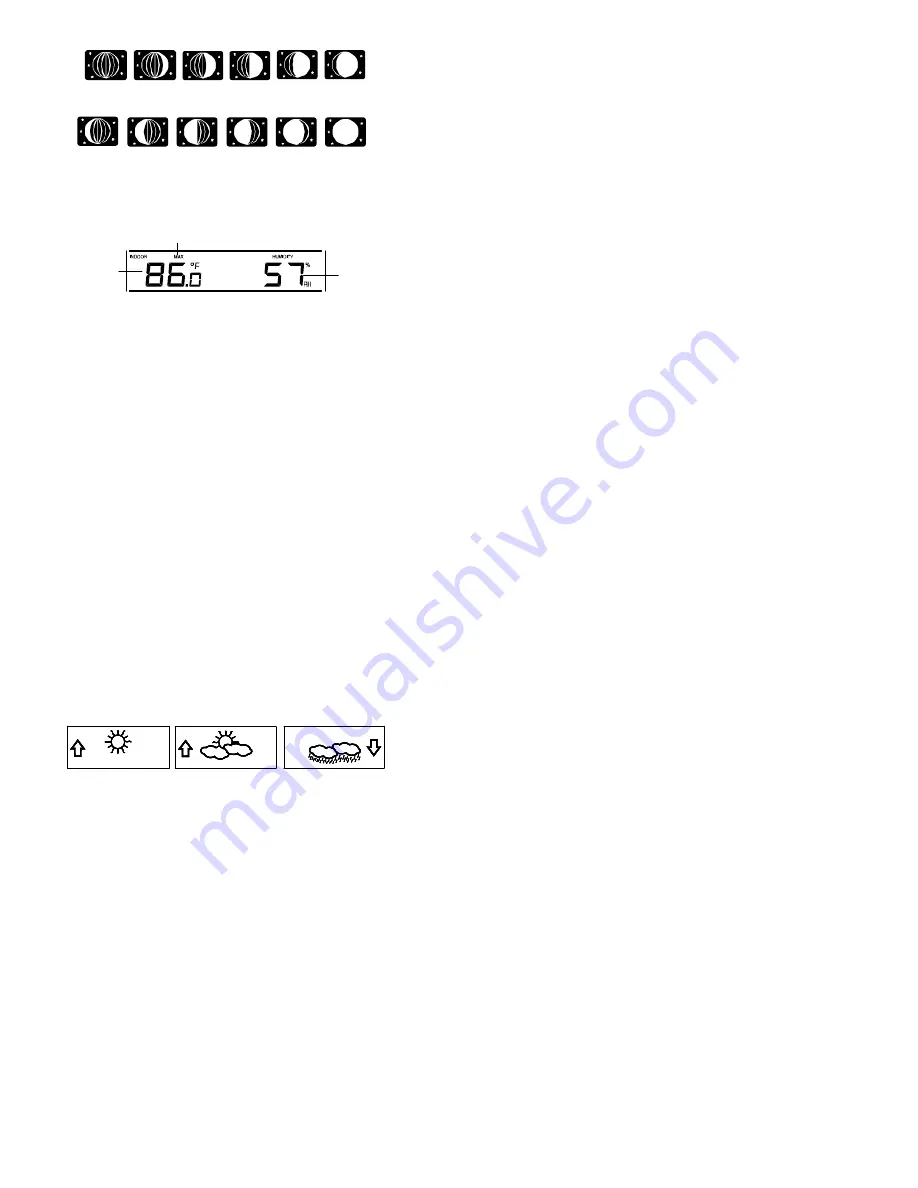
The indoor temperature and humidity data and the indoor comfort
indicator are automatically updated and displayed on the second section
of the LCD.
Indoor
relative
humidity
in RH%
Indoor
temperature
in °C or ºF
MAX icon
New Moon
Small
Waxing
Crescent
Large
Waxing
Crescent
First
Quarter
Small
Waxing
Gibbous
Large
Waxing
Gibbous
Small
Waning
Crescent
Large
Waning
Crescent
Last
Quarter
Small
Waning
Gibbous
Large
Waning
Gibbous
Full Moon
30
THE COMFORT LEVEL INDICATOR:
Comfortable
: A happy face icon “
” indicating a temperature
level between 68*F and 78.6 *F (20°C and 25.9°C)
and relative humidity reading between 45% and
65%.
Uncomfortable
: A sad face icon “
” indicating any value outside the
comfortable range.
TOGGLING AND RESETTING THE INDOOR READINGS:
1.
To toggle between the current indoor and the MAX/MIN indoor
temperature and humidity data and the times (for temperature data
only) they were recorded press the IN key:.
-
Once to show the MAX indoor temperature and humidity
data with the recorded time and date.
-
Twice to show the MIN indoor temperature and humidity data
with the recorded time and date.
-
Three times to return to the current displayed values
2.
Once the MIN or MAX data is displayed, press and hold the SET
key for 3 seconds to reset the respective MIN or MAX record to
current temperature and humidity data, and current time, date
display.
31
Note:
The MIN or MAX data needs to be reset individually.
WEATHER FORECAST AND WEATHER TENDENCY:
WEATHER FORECASTING ICONS:
Weather icons in the third section of LCD can be displayed in any of the
following combinations:
Sunny Cloudy with sunny intervals Rainy
For every sudden or significant change in the air pressure, the
weather
icons will update accordingly to represent the change in weather. If the
icons do not change, then it means either the air pressure has not
changed or the change has been too slow for the Weather station to
register. If the icon displayed is a sun or raining cloud, there will be no
change of icon if the weather gets any better (with sunny icon) or worse
(with rainy icon), since the icons are already at their extremes.
FORECAST
FORECAST
FORECAST
32
The icons displayed forecast the weather in terms of getting better or
worse and not necessarily sunny or rainy as each icon indicates. For
example, if the current weather is cloudy and the rainy icon is displayed, it
does not mean that the product is faulty because it is not raining. It simply
means that the air pressure has dropped and the weather is expected to
get worse but not necessarily rainy.
Note:
After setting up, readings for weather forecasts should be disregarded for
the next 48-60 hours. This will allow sufficient time for the Weather station
to collect air pressure data at a constant altitude and therefore result in a
more accurate forecast.
Common to weather forecasting, absolute accuracy cannot be
guaranteed. The weather forecasting feature is estimated to have an
accuracy level of about 75% due to the varying areas the Weather station
has been designed for use in. In areas that experience sudden changes
in weather (for example from sunny to rain), the Weather station will be
more accurate compared to use in areas where the weather is constant
most of the time (for example mostly sunny).


