Laetus web technology | 13 9 66 0802 | FirmwareVersion 1.1.x/2.0.x | 2009-10
59
Production – Control
5.2.3 Timing Diagram
Press the
Timing Diagram
button.
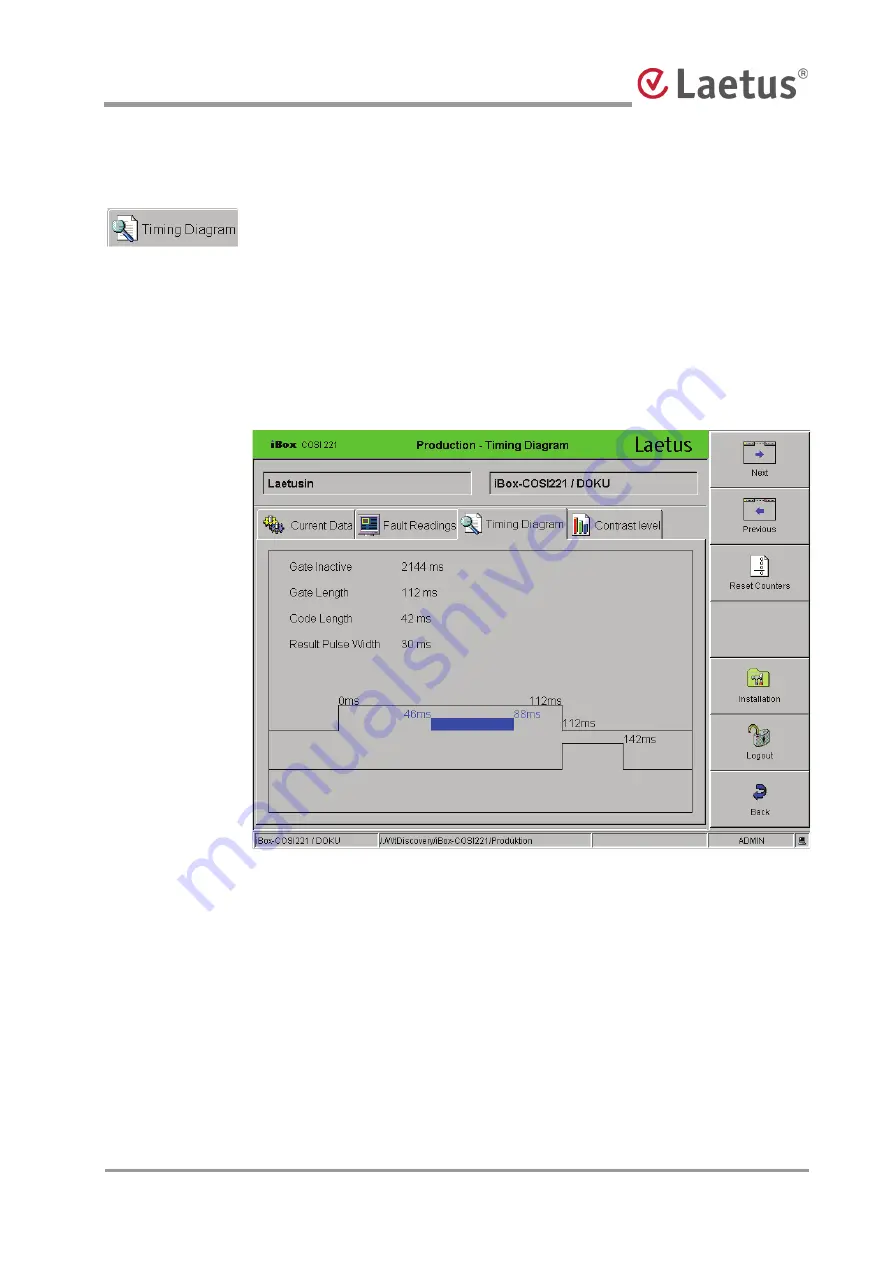
The "Production – Timing Diagram" menu appears, displaying the following for the
selected sensor head:
Gate Inactive
Gate Length
Code Length
Result Pulse Width
Fig. 58 Production – Timing Diagram menu
Starting with the falling edge of the last gate, all important events up to the next falling
edge are listed and depicted graphically with their distance in time. This allows you
to determine the position of the code within the gate. (The last reading is displayed).
The system continues running while displaying the timing diagram, i.e. the machine
does not need to be stopped.


