8
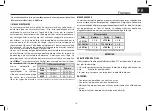
Percentage of Body Water
Normal
% Body Water
Men
50-65%
Women
45-60%
The % of water in the body differs based on gender: in healthy adult women
it ranges from 45% to 60% while in men it ranges from 50% to 65%.
The percentage of water is greater in childhood and
decreases with age. Body weight variations can occur in a short period of
time (hours), a medium period (days) or over a long period (weeks). Small
variations in weight over a few hours is normal and due to water
retention since extracellular water (which includes the interstitial fluid,
When weight losses occur in just a few days,
it is very likely that it is part of the total water.
In
Fitdays™
, there will be an automatic
comparison of your measured body water %
against a range chart for your reference.
Body Mass Index
BMI Table
BMI Value
Underweight
<18.5
Normal
18.5-24.9
Overweight
25.0-29.9
Obese
>30
The body mass index (BMI) is the
relation of body weight to height.
The
classification
given below is correlated to the risk that
body weight exerts on health.
When BMI is between 18.5 and 24.9 it
means that the weight does not statisti-
It is important to know that BMI does not allow accounting for weight
variations due to muscle mass, bone mass, water content or fat accumula-
tion. Therefore, a simple BMI calculation alone should not be misinterpret-
ed. The evaluation of BMI should be made by a doctor or other specialists
such as a nutritionist or dietitian. In
Fitdays™
, there will be an automatic
comparison of your measured BMI against a range chart for your
reference.
Muscle Mass Percentage
Muscle mass is the weight of your muscles in you body.There are three
different types of muscle: smooth, striated skeletal, and striated cardiac.
Smooth muscle is made of smooth fibres. These are found in the walls of
the digestive tract, respiratory tract, and genital tract and in the wall of
the venous and arterial blood vessels. Human striated skeletal muscle is
in the skeletal and facial muscles.
C a r d i a c
striated muscle is found in the heart. Muscles play an important part in
the overall health, including maintaining regular body functions. Muscle
mass starts to decrease with age. Keeping track of muscle metrics
overtime, along with other body composition metrics, can provide
indications of your health fitness.
This
scale
captures and displays in the
Fitdays™
app 3 muscle metrics: muscle
mass (lbs/kg), muscle rate (all muscle types) and skeletal muscle (%). On
average, 40% of body mass is made up of skeletal muscles.
6
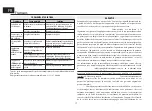
Bodyfat Table
Women
Men
Thim
Athietes Fitness Acceptable Too high
<14%
<6%
14~21%
6~13%
25~32%
17~25%
>=32%
>=25%
21~25%
13~17%
*The data in the table is for references only.
Any deviation, above or below this BMI interval should be considered a
health risk. In this case, we recommend consulting a physician. Getting in
the habit of following a balanced diet helps improve quality of life,
promote health and prevent illness, increase vitality, and maintain ideal
20-39
40-59
60-79
Age
% MUSCLE MASS NORMAL RANGE
Men
75-89%
73-86%
70-84%
Women
63-75.5%
62-73.5%
60-72.5%
*The data in the table is for references only.
E N
E nglis h


