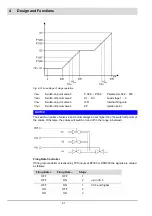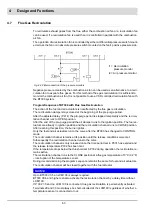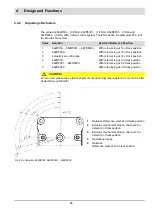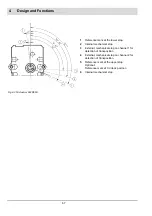
55
4
Design and Functions
4.5
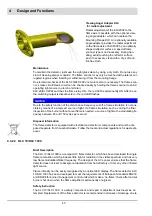
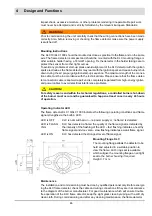
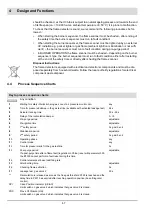
Leakage Test for Main Gas Valves
4.5.1
Calculation Example
With BT300 the gas pressure monitor is also applicable to the monitoring of minimal gas pres-
sure. Therefore the minimal gas pressure of the burner must be set.
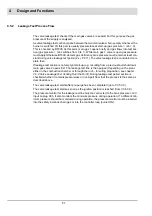
The valve leakage test time t3 (P 311) would be set by BT300. The time t2 for BT300 is fixed
to 2s. The time t3 (P 311) must be set in a way that the maximum allowable leakage rate Q
Leck
can be securely detected. The maximum leakage rate stated in EN1643 and ISO23551-4 is
0.1% of the nominal volumetric flow of the gases or a minimum of 50l/h.
Example 1
Burner capacity =1000 KW
Fuel = natural gas H, calorific value = 10 kW/m
3
Nominal volumetric flow of the gases = 100 m
3
/h
Leakage rate max. = 0,1 m
3
/h or 100l/h
Example 2
Burner capacity =1000 KW
Fuel = propane, calorific value = 25,9 kW/m
3
Nominal volumetric flow of propane = 38,6 m
3
/h
Leakage rate max. = 50 l/h (not 38,6 l/h)
Calculation
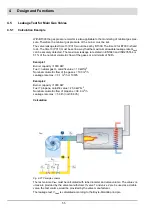
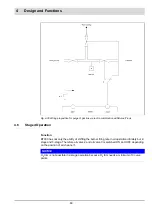
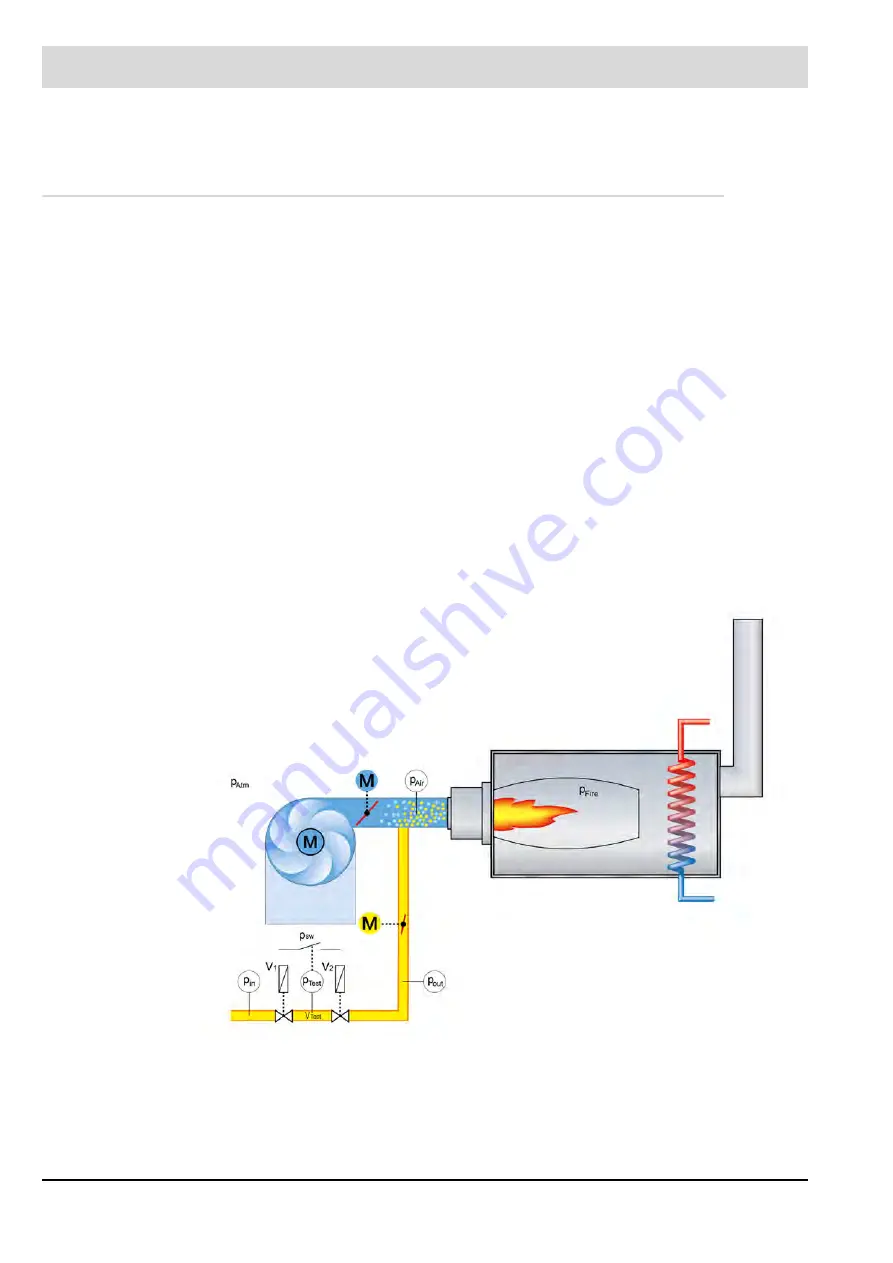
Fig. 4-27 Principle scheme
The test volume V
test
must be calculated with tube diameter and valve volume. The value vol-
umes are provided by the valve manufacturer. If valve 1 and valve 2 are be used as a double
valve, the test volume would be provided by the valve manufacturer.
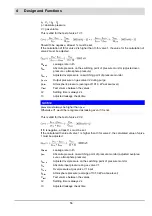
The leakage test V
Leak
is calculated according to the Boyle-Mariotte principle.
Summary of Contents for BT300 BurnerTronic
Page 2: ......
Page 25: ...24 3 Product Description Fig 3 9 Temperature derating BT300 for operation 2000 m NHN...
Page 49: ...48 4 Design and Functions Fig 4 20 Oil with pilot burner BT300...
Page 50: ...49 4 Design and Functions Fig 4 21 Oil without pilot burner BT300...
Page 51: ...50 4 Design and Functions Fig 4 22 Gas with pilot burner and leakage test BT300...
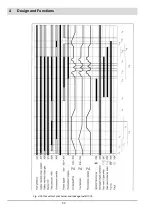
Page 52: ...51 4 Design and Functions Fig 4 23 Gas without pilot burner and leakage test BT300...
Page 53: ...52 4 Design and Functions Fig 4 24 Oil without pilot burner BT335...
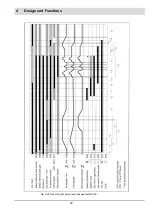
Page 54: ...53 4 Design and Functions Fig 4 25 Gas without pilot burner and leakage test BT335...
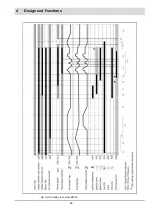
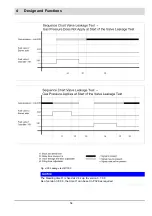
Page 59: ...58 4 Design and Functions Fig 4 28 Leakage test process diagram...
Page 98: ...97 6 Operating Control and Displays...
Page 99: ...98 6 Operating Control and Displays...
Page 103: ...102 6 Operating Control and Displays...
Page 105: ...104 6 Operating Control and Displays...
Page 106: ...105 6 Operating Control and Displays...
Page 107: ...106 6 Operating Control and Displays...
Page 109: ...108 6 Operating Control and Displays...
Page 126: ...125 6 Operating Control and Displays 6 3 4 2 Curve Table Fig 6 37 Curve table window...
Page 246: ...242 10 EU Declaration of Conformity 10 EU Declaration of Conformity...
Page 247: ...243 10 EU Declaration of Conformity...

