Lantronix
SM12XPA Web User Guide
33848 Rev. A
Page
51
of
473
Port Statistics
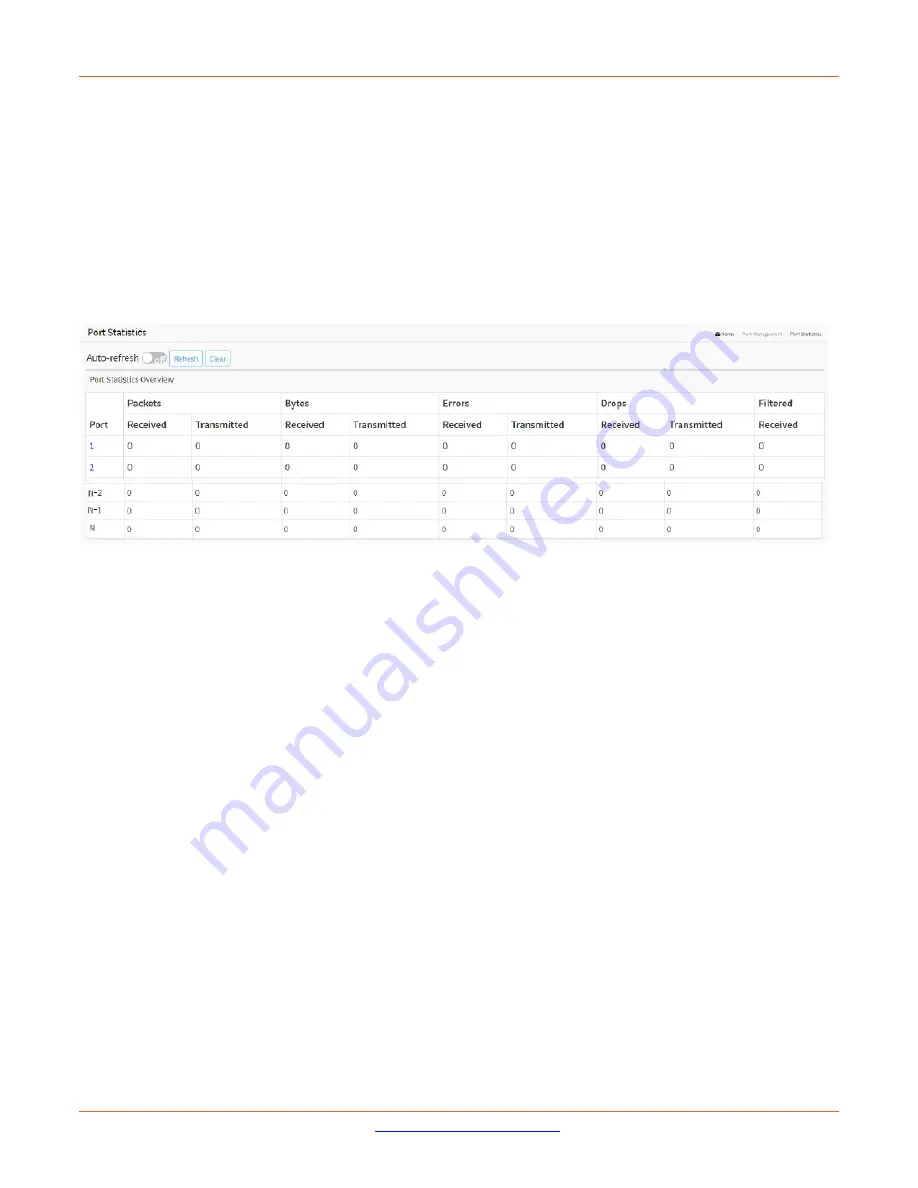
This page displays Port statistics information and provides general traffic statistics for all switch ports.
Web Interface
To display Port Statistics overview in the web UI:
1.
Click Port Management and Port Statistics.
2.
To auto-refresh click the “Auto-refresh” button.
3.
Click “ Refresh“ to refresh the port statistics or clear all information when you click “ Clear”.
4.
To see the details of a port’s statistics, click that port.
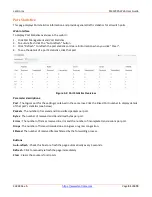
Figure 3-2: Port Statistics Overview
Parameter descriptions:
Port
: The logical port for the settings contained in the same row. Click the linked Port number to display details
of that port’s statistics (see below).
Packets
: The number of received and transmitted packets per port.
Bytes
: The number of received and transmitted bytes per port.
Errors
: The number of frames received in error and the number of incomplete transmissions per port.
Drops
: The number of frames discarded due to ingress or egress congestion.
Filtered
: The number of received frames filtered by the forwarding process.
Buttons
Auto-refresh
: Check this box to refresh the page automatically every 3 seconds.
Refresh
: Click to manually refresh the page immediately.
Clear
: Clears the counters for all ports.

