Lantronix
SM12XPA Web User Guide
33848 Rev. A
Page
260
of
473
Status
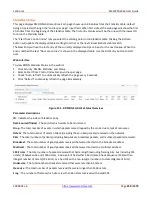
This page displays RMON Event table entries. Each page shows up to 99 entries from the Event table, default
being 20, selected through the "entries per page" input field. When first visited, the web page will show the first
20 entries from the beginning of the Event table. The first displayed will be the one with the lowest Event Index
and Log Index found in the Event table.
The "Start from Event Index and Log Index" lets you select the starting point in the Event table. Clicking the
Refresh button will update the displayed table starting from that or the next closest Event table match.
The Next Entry button uses the last entry of the currently displayed entry as a basis for the next lookup.
When the end is reached the text "
No more entries
" is displayed in the table. Use the First Entry button to start
over.
Web Interface
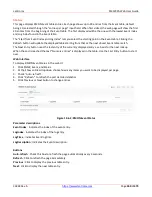
To display RMON Event Status in the web UI:
1.
Click SNMP, Event, and Status.
2.
At the Show entries dropdown choose how many items you want to be displayed per page.
3.
Check “Auto-refresh”.
4.
Click “ Refresh“ to refresh the port detailed statistics
5.
Click Previous or Next button to change entries.
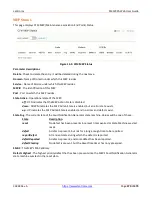
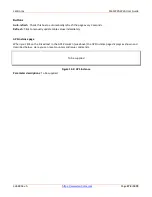
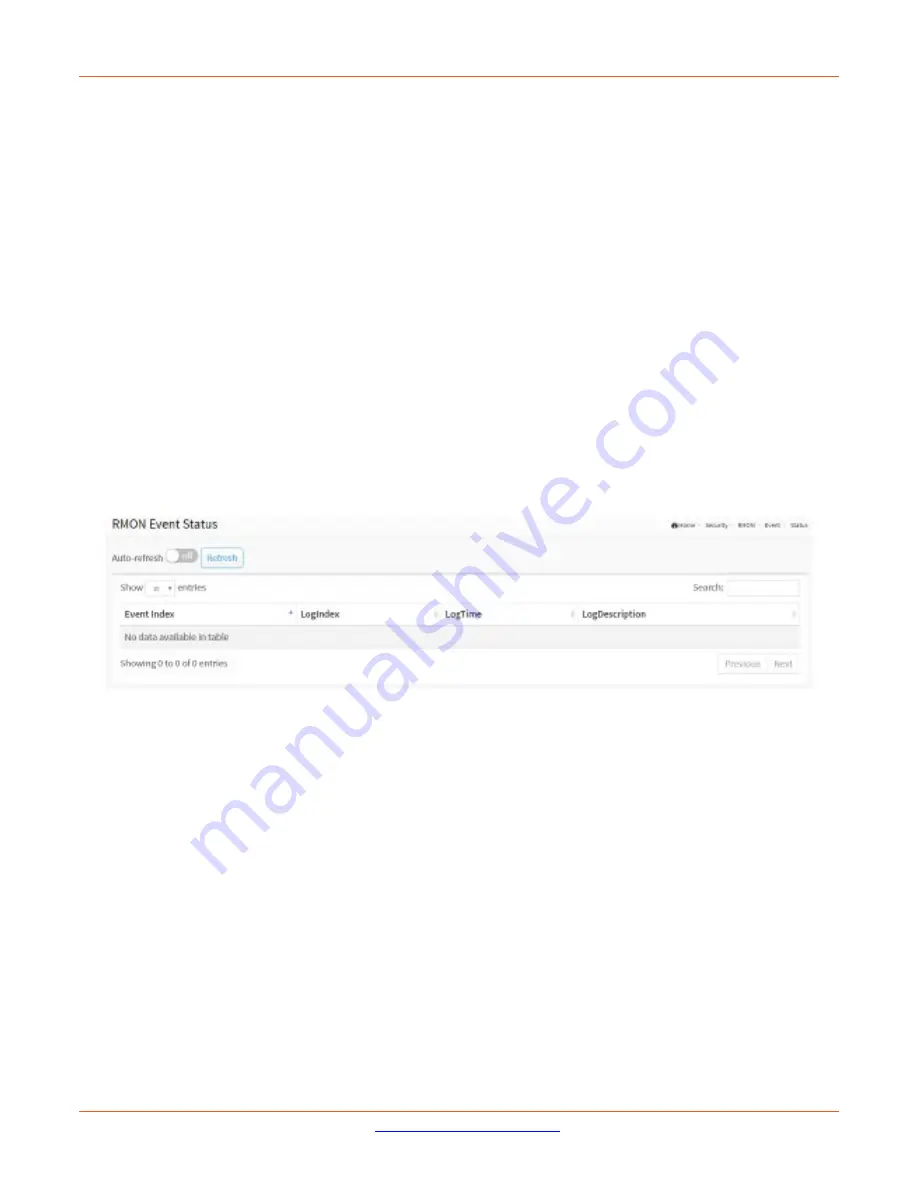
Figure 13-6.2: RMON Event Status
Parameter descriptions
:
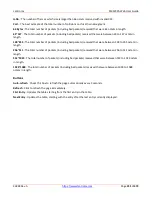
Event Index
: Indicates the index of the event entry.
LogIndex
: Indicates the index of the log entry.
LogTIme
: Indicates Event log time
LogDescription
: Indicates the Event description.
Buttons
Auto-refresh
: Check this box to refresh the page automatically every 3 seconds.
Refresh
: Click to refresh the page immediately.
Previous
: Click to display the previous table entry.
Next
: Click to display the next table entry.

