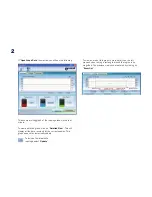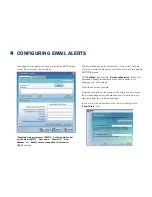
If “
Open Graph Data
” is selected, you will see the following:
This shows a rolling graph of the readings taken in the last
minute.
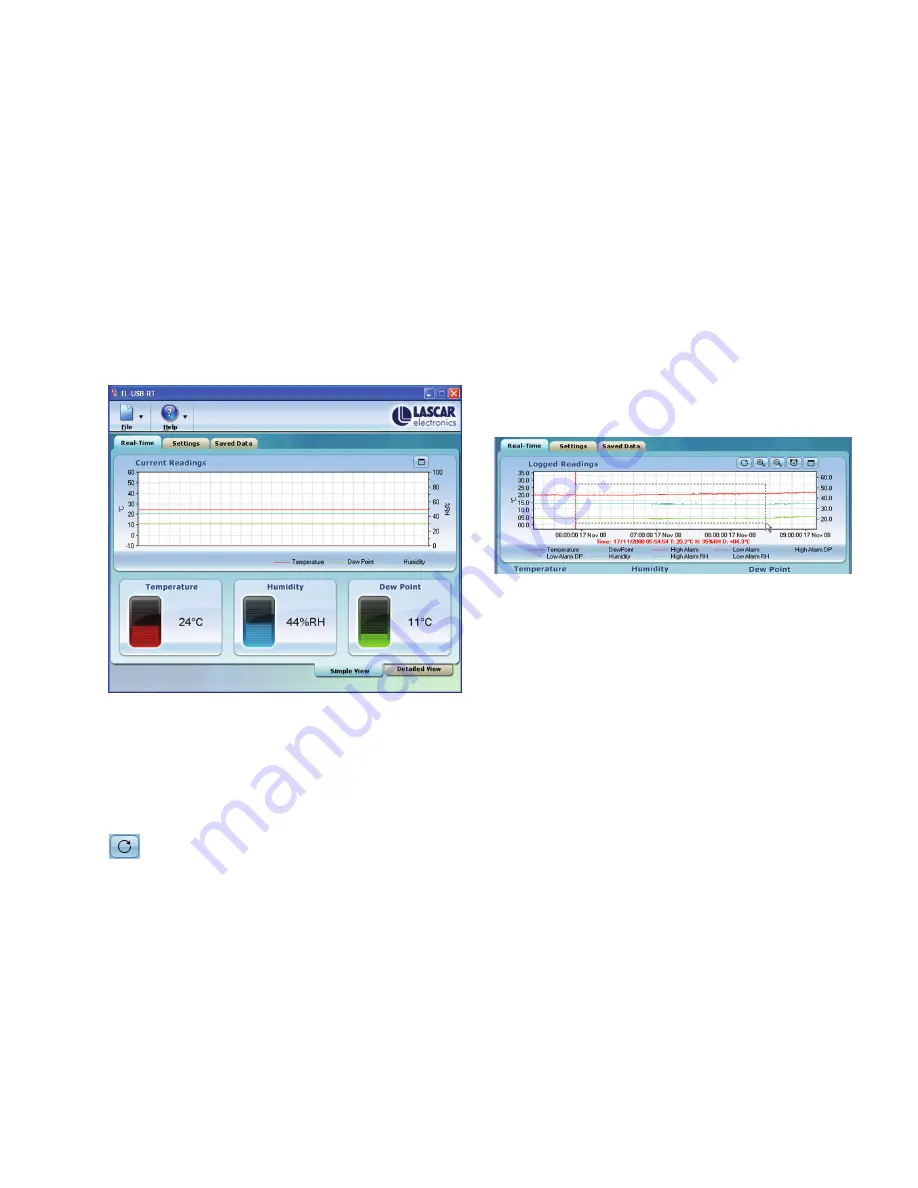
To view an area of this graph in more detail, use the left
mouse button to drag a rectangle around the region to be
magnified. The previous view can be restored by clicking on
“
Zoom Out
”.
2
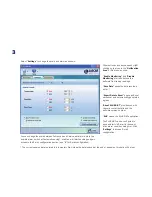
To view a detailed graph, click on “
Detailed View
”. This will
display all the data recorded for the current session. This
graph does not automatically update.
To include the latest data
readings select “
Update
”.


