background image


44 of 49 

June 2012 


Cursor measurements 

On-screen cursors can be used to make measurements from the trace, as in the 
following example: 


The cursors are enabled by checking the box in the 

Cursors

 group. The left-hand 

cursor is placed by positioning the mouse pointer and clicking the left button. The 
right-hand cursor is placed in the same way with the right mouse button. Four cursor 
functions are available, selectable from the drop-down menu: 
 

  Power difference (

Δ

P)


  Time difference (

Δ

t)


  Frequency 

– the time difference is regarded as one period of a periodic 

waveform


Energy – the power readings between two time cursors are integrated to give 

the energy delivered over the time period 


Summary of Contents for ADM-1000

Page 1: ...Advanced Digital Meter ADM 1000 Operating Instructions Including PC Interface Software for the Remote Operation of Meter Part 2 of manual June 2012 ...

Page 2: ...e PC Interface Program extends the user interface of the meter The meter can be operated remotely Waveforms can be observed in more detail and saved as images or data Logging can be used to observe laser performance over long periods Log files can be saved in Excel compatible format and recalled for display The program requires a PC running Windows XP or Windows 7 with at least 25MB of hard disk s...

Page 3: ...ak Average Measurement 16 Setting Average and Peak Hold Periods 16 Trend Bargraph 16 Zero Offset 17 Backlight 17 Display Contrast 18 Graphical Mode Functions 19 Setting X and Y scales 19 Timebase Horizontal Scale setting 20 Start Acquisition 20 Rolling Display 20 Y scale Range setting 20 Bandwidth Limit 21 Trigger setting 21 Auto Mode 23 Normal Mode 24 Manual Mode 24 Cursor Function 25 Setting the...

Page 4: ...r mode 39 Zeroing the meter 39 Wavelength display 39 Capturing a log file 40 Viewing a log file 41 Using Excel 41 Using the internal viewer 42 Graphical waveform display 43 Cursor measurements 44 Screen appearance 45 Saving a waveform 45 Saving a waveform as an image 45 Saving a waveform as data 47 Reading the ADM 1000 firmware version 48 Note on USB time outs 48 Trademarks 48 ...

Page 5: ... are from 180 20 000nm Safety The ADM 1000 its battery pack and mains power adaptor are intended for indoor or occasional dry outdoor use Do not expose this apparatus to rain moisture or extremes of temperature or humidity Do not attempt to dismantle the meter power supply or battery pack no user serviceable parts inside Hazardous voltages are present inside the mains power adaptor Use of this equ...

Page 6: ...r lead The following optional items are selected by the user Standard ABS carry case ADM CA S Designed for ADM1000 2 Heads Power Supply Cables Standard Photodiode Head IPDH 10S Compact Photodiode Head IPDH 10C Thermal Head ITDH 100P All of the heads have standard threads so that optical table posts can be used The above photo shows the ADM1000 Laser Power Meter in its carry case with two detector ...

Page 7: ...ng a response time of 20 ms patented advanced integrated temperature stabilisation circuitry to reduce drift thermal interference Patent numbers Peltier Temperature Compensation UK Patent number 2447294 European Patent Number 08250712 0 and ADI Head Interface Patent Number 09250671 6 Integrating sphere within unit Laser light aperture Analogue output socket to connect to oscilloscope etc An adapte...

Page 8: ...propriate head for the laser you are measuring The specification of the laser or markings on the laser machine should indicate the laser power If the heads are subjected to laser power exceeding the above figures the meter will show Over Range on the display and heads may become damaged or go out of calibration depending on the amount of excess power they are subjected to Potential damage is also ...

Page 9: ...er supply is included with the ADM 1000 The lead is connected to the 6VDC IN socket on the end of the ADM 1000 the power supply is then plugged into the mains The ADM 1000 will operate from the power supply regardless of whether the battery pack is fitted or not The use of unapproved power sources should be avoided to prevent damage to the unit If the battery pack is fitted to the ADM 1000 the pow...

Page 10: ...an 24 hours New battery packs may only have a small amount of charge in them and will require charging before use Note that new battery packs or packs which haven t been used for a long time will require several charge discharge cycles before they reach full capacity The ADM 1000 will typically run for 5 hours or more on a good fully charged battery pack A longer operating time will be achieved if...

Page 11: ...d head If no head is connected the message No Head flashes on the display and the meter should be turned off before attaching a head If powering the unit from a P C using a USB port the unit will turn itself on as soon as the P C enables the USB port To turn the unit off press and hold the O button at the top of the keypad until the unit turns off If the ADM 1000 is connected to a USB port turn it...

Page 12: ...12 of 49 June 2012 Diagram 1 O I 7 9 4 5 6 1 2 3 0 ACQ 8 Power Of f Power On Backlight Menu Display Mode Enter Undo Keypad Layout ...

Page 13: ...he full scale on the selected range Depending on the head type other information may be displayed such as wavelength and detector temperature Diagram 2 Digital Display Graphical Display Features Dot matrix graphical display of actual value over time with indications of X time and Y magnitude scales User operable cursors may be turned on to make measurements on the waveform In either mode pressing ...

Page 14: ...the full scale range can be set manually or automatically auto range The auto range function is not available in the waveform display mode Manual Range Setting If the word AUTO is shown at the bottom right corner of the display this indicates that the meter is in auto range mode Press the 5 key to remove the AUTO indication and enable manual range setting To set the full scale range press the down...

Page 15: ...nge and press The Auto indication will flash if an attempt is made to manually change the range while in auto range mode Note that auto range facility is not available in the graphical display mode Wavelength Photodiode heads do not have a linear response and the wavelength of the incident radiation must be entered by the operator for meaningful measurements to be made The wavelength response of e...

Page 16: ...is no option to set peak or average mode Setting Average and Peak Hold Periods For more accurate mean measurements a longer average period is recommended A short average period will result in a less accurate value but with a faster response time To set the Average Period press Menu and scroll to Measurement Mode Select Average Period The current Average Period is displayed Use the Up Down arrow bu...

Page 17: ...he zero value that was set at the last calibration press the menu button scroll down to Zero press Select the Clear option and press The zero facility may be used to make relative offset measurements This might be useful for example where a steady background or reference light level exists and it is desired to measure any increase above the background In this instance the zero value is set with th...

Page 18: ... contrast press Menu scroll down to Display press Scroll down to Contrast press The current contrast level is displayed Use the up down buttons to change the contrast over the range 0 30 for best viewing Press when done The display returns to main display ...

Page 19: ...low the measurement of pulse repetition frequency and period To switch to Graphical Mode press the display mode button In graphical display mode there are two modes which enable quick selection of the most commonly used commands The mode is indicated by the label Rng or Trg in the bottom right corner of the display and the mode can be switched between the two by pressing the 5 button The Rng mode ...

Page 20: ...o perform various calculations on the displayed waveform see Cursor Function Rolling Display At slow timebases 500ms div the trace will travel across the display until it reaches the right hand side whereupon the waveform will start scrolling to the left as new data is added to the right Stripchart mode Press the Acquire button 0 to manually start stop the stripchart display Y scale Range setting ...

Page 21: ... a train of pulses it is usual to set a trigger point so that each time the instrument redraws the waveform it starts at the same place and a stable display is achieved For all but the very slow timebases it will be necessary to set the vertical trigger level correctly to produce a stable display When the instrument is not triggered No trig is shown at the top of the display and any pulses will be...

Page 22: ...rom a decade setting to a more sensitive 5 or 2 setting the trigger level will hold the same absolute value so that the same actual trigger point is maintained This may mean that it will disappear off the top of the screen If you want to relocate the trigger level into the visible area press and the trigger level will be reset to the middle of the screen Use the left and right buttons to move the ...

Page 23: ... of the waveform display Auto Mode In Auto mode if no valid trigger occurs after a short period of time the display will show whatever signal is currently being seen and the words No trig are shown at the top of the display If regular pulses are detected and the trigger level is set correctly the display will lock onto the pulse and Trig is shown at the top of the display When the timebase is set ...

Page 24: ...ce the meter has triggered and displayed a waveform the captured waveform is kept on the display until the next trigger occurs This gives the user the ability to see and measure short pulses that might occur infrequently Normal mode often gives a clearer display than Auto mode especially if the pulses to be observed are infrequent or sporadic Manual Mode In either of the above trigger modes the si...

Page 25: ...f the cursors is usually the very left side of the screen one on top of the other One of the crosses is flashing to show which is selected Use the left and right arrow buttons to move it Press 5 to select the other cursor and move it The calculated value is shown at the top of the display To change the type of calculation press to toggle through the available calculations The type of calculation c...

Page 26: ... for measuring pulse amplitudes or amplitude differences 1 t Frequency This is used to measure frequency PRF in Hertz The display should if possible be arranged so that two pulses can be seen and the cursors should then be set to the same point on each of the two adjacent pulses ...

Page 27: ...in the pulse is displayed The total energy between any two points can also be shown The example below right shows how the total energy in a burst of pulses can be determined Important Note The energy calculation works by calculating the area under the graph between the cursors Any zero offset may cause significant errors For proper accuracy the meter should be zeroed before making an energy calcul...

Page 28: ...se to the detector as practicable but it should be borne in mind that the sensor s response gives an average indication and may it not be able to give adequate warning if the detector suddenly sees an excessively large potentially damaging signal Head Information Press Menu Scroll down to Info Select Head and press to display information about the head including serial number type and last calibra...

Page 29: ... Detector Input Lasermet Detector Heads DVI I connector Analogue sample rate Depends on Detector Head type up to 1MHz Analogue risetime 700ns typical Analogue input voltage range 0 10V Sensitivity Depends on Detector Head type Fastest timebase 10µs division Minimum pulse capture 1 4µs Meter Power Input 5 0 6 0V DC 400mA typical Battery Pack 4 8V NiMH 2000Ah External Interfaces USB 1 0 RS232 Mains ...

Page 30: ... supply of its own or a long USB lead is used the meter will need batteries or a power adaptor In this instance once the meter has been connected and installed as described below it will need to be turned on and off manually as normal To connect the meter to the P C plug the supplied USB lead into the power meter and a spare USB port The P C should enter the Found New Hardware wizard If the P C as...

Page 31: ...section Connecting the ADM 1000 to a P C above Once the drivers are installed it is necessary to find out which COM port has been allocated to the ADM1000 To do this click Start then Control Panel then System When the System Properties box opens click Device Manager Click on the sign next to Ports COM LPT In the list should be the entry Lasermet ADM 1000 COMX where X is the COM port number Make a ...

Page 32: ... save the data carriage return characters will be included in the data corresponding to the width of the Hyperterminal window This is likely to be undesirable Data output The ADM1000 outputs a series of values in ASCII format Only the numerals and any decimal point are output In Numerical display mode the ADM1000 outputs data at the same rate that it updates its screen display usually several upda...

Page 33: ...te the software in the ADM 1000 first connect and install the ADM 1000 on a PC as described above Next locate the new software in a convenient folder on the PC from where it can be accessed The ADM Update utility may be run from the installation CD or it may be copied into a folder on the PC If moving ADM update into a new folder ensure that AdmUpdate exe and LpmProtocol dll are both copied to the...

Page 34: ...d then click Start The meter should give two short beeps and the download should start automatically On completion the meter should restart showing the new version on the screen The ADM Update utility will show Successful Update as shown above and can then be closed ...

Page 35: ...35 of 49 June 2012 Advanced Digital Meter ADM 1000 PC Interface Program User Manual Part 2 May 2012 ...

Page 36: ...ws 7 with at least 25MB of hard disk space available A USB port should be available The program requires an ADM 1000 loaded with firmware version 0 0 0 59 or later Installation The program is supplied as an executable installer either by download or on a CD or DVD If the program is supplied on a disk insert the disk into your disk drive If the installer does not run automatically navigate to the d...

Page 37: ...the Windows Found New Hardware wizard In this case follow the instructions in the ADM 1000 meter manual to install the USB drivers When this has been done the PC is ready to communicate with the meter To run the PC Interface program double click on the icon The program will search for communications ports and will display a drop down list This list will contain the USB serial port used for the met...

Page 38: ...38 of 49 June 2012 You will now know which COM port to select from the drop down list so make the selection and click on OK The main window of the program should open ...

Page 39: ... Meter mode The meter can be set to average over a period of time or to hold the peak power for a period of time Each period can be selected from a drop down list Zeroing the meter To set the meter zero go to the Meter menu and select Zero meter This will set the current meter reading as the zero level This user defined zero level can be cleared by selecting Clear zero from the same menu Wavelengt...

Page 40: ...is is one data point Select the total recording time This is the time the program will allow before automatically switching off the logging function Logging can also be stopped manually but this function can be useful if you will not be present at the end of the desired period The total number of data points recorded will be the total recording time divided by the time between readings If you woul...

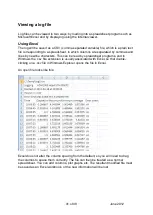
Page 41: ... lines by newline characters This can be read by spreadsheet programs and in Windows the csv file extension is usually associated with Excel so that double clicking on a csv file in Windows Explorer opens the file in Excel An open file looks like this Excel does not alter the column spacing from the default so you will need to drag the columns to space them correctly The file can then be treated a...

Page 42: ...o view again using the Browse button is the easiest way and click on View file The log file will be displayed as a graph This shows a file captured with readings every 10 seconds for 10 minutes using error limits of 0 2mW and 0 8mW To see the graph in greater detail you can expand the window by dragging the borders ...

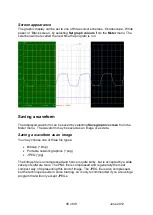
Page 43: ...e can be selected from the range available to the meter by using the drop down selectors The trigger can be set to normal or auto mode and to positive or negative edges The trigger level can be adjusted using a slider control and is displayed as a small triangle on the Y axis The trigger point in time is fixed and both pre and post trigger data are displayed The trace zero level can be shifted up ...

Page 44: ...itioning the mouse pointer and clicking the left button The right hand cursor is placed in the same way with the right mouse button Four cursor functions are available selectable from the drop down menu Power difference ΔP Time difference Δt Frequency the time difference is regarded as one period of a periodic waveform Energy the power readings between two time cursors are integrated to give the e...

Page 45: ...m the Meter menu The waveform may be saved as an image or as data Saving a waveform as an image You may choose one of three file types Bitmap bmp Portable network graphics png JPEG jpg The bitmap file is uncompressed and hence is quite bulky but is accepted by a wide variety of software tools The PNG file is compressed and is generally the most compact way of representing this kind of image The JP...

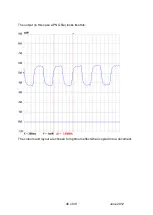
Page 46: ...46 of 49 June 2012 The output in this case a PNG file looks like this The colours and layout are chosen for optimum effect when copied into a document ...

Page 47: ... a CSV file instead The program will save the trace in a form that can be opened in Excel with the following result This shows the beginning of the data file for the waveform shown previously All the points used to display the trace will be saved The spreadsheet can be processed and saved as an Excel workbook ...

Page 48: ...er than 0 0 0 59 do not support this command Note on USB time outs If the USB port is connected then left for a period of time without any port activity the computer may turn off the 5V supply to the port rendering it inoperable If you find the meter does not respond to the program after an idle period remove and reconnect the USB connector This should re activate the port at the PC end Trademarks...

Page 49: ...utters Warning Signs Laser Enclosures Curtains and Blinds Laser and LED test and classification service Laser and IPL safety consultancy for clinics and medical practitioners Please visit our website www lasermet com For general enquiries and sales please call or email office lasermet com Lasermet Limited 137 Hankinson Road Bournemouth BH9 1HR United Kingdom Tel 44 0 1202 770740 Fax 44 0 1202 7707...

Reviews: