3.
Press the Enter key.
The entry window appears. The cursor flashes under the tem-
perature value. The upper and lower temperature range is dis-
played.
4.
Change the value with the arrow keys.
By pressing the
[ESC]
key, you return to the previous menu
without making any changes.
5.
Press the [OK] to confirm the new value.
The new value is active.
5.3.3 Graph window
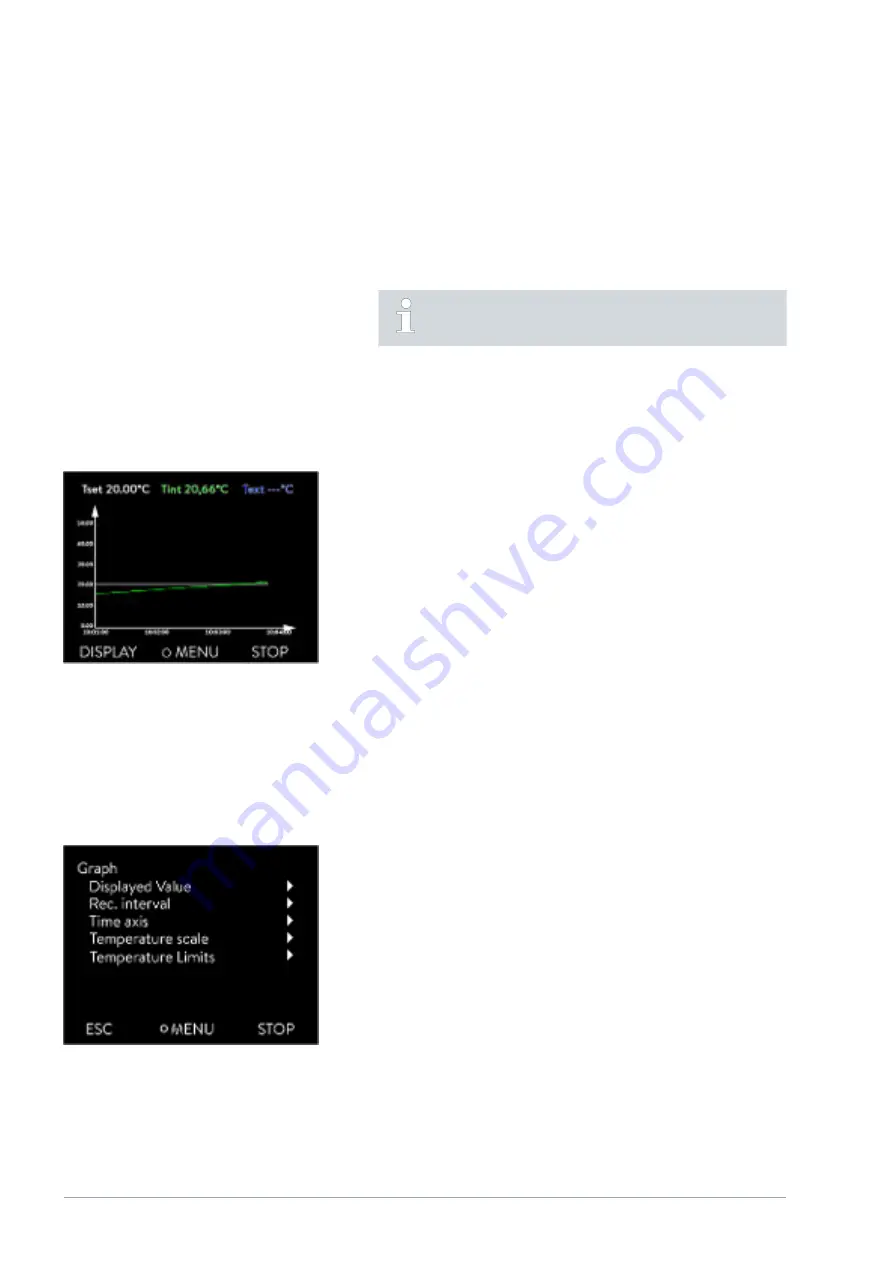
The display offers you the possibility to display temperature curves graphi-
cally.
The graphics window can be accessed via the [Display] softkey in the home
window of the display.
n
T
set
indicates the set temperature (gray).
n
T
int
indicates the internal temperature (green) of the heat transfer liquid
in the device.
n
T
ext
indicates the external temperature (dark blue) of the heat transfer
liquid in the consumer.
n
Use the arrow keys to scroll the graphic in any direction.
1.
Press the Enter key to open the menu.
2.
Select the
Graphic
menu item.
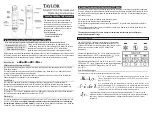
The Graphic submenu opens.
In this submenu, you can adapt the graphics window to your requirements.
n
[Display measurement values]: T
set
, T
int
, T
ext
and T
ext2
.
Here you can define which temperatures are displayed in the graph.
n
[Sample time]: 2 s (maximum 50 min), 10 s (maximum 4 h), 30 s
(maximum 12 h), 1 min (maximum 24 h) or 2 min (maximum 48 h).
Here you can define the time interval at which new temperature values
are measured.
n
[Time Axis]: auto, 9 min, 45 min, 2 h15 min, 4 h30 min , 9 h, 24 h or
48 h.
Here you can define the time range displayed in the visible graph window
(corresponds to scaling of x axis).
Fig. 34: Graph window
Edit the graphic window
Fig. 35: Graphic menu
V6
Integral Process Thermostats and High-Temperature Thermostats
68 / 198


