Page 14
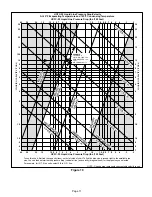
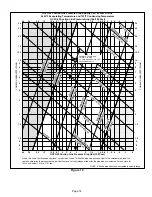
HCFC22 Suction Line Pressure Drop/Velocity Per 100 Feet Of Line
At 45°F Evaporating Temperature and 125°F Condensing Temperature
30
25
20
15
10
9
8
7
6
5
4
3
2
1.5
1.0
.9
.8
.7
10 9 8 7
6
5
4
3
2
1.5
1.0 .9 .8 .7 .6
.5
.4
.3
.2
HCFC22 Suction Line Pressure Drop (lbs./100 Feet)
COOLING CAP
ACITY
(
T
ONS)
30
25
20
15
10
9
8
7
6
5
4
3
2
1.5
1.0
.9
.8
.7
COOLING CAP
ACITY
(
T
ONS)
10 9 8 7
6
5
4
3
2
1.5
1.0 .9 .8 .7 .6
.5
.4
.3
.2
HCFC22 Suction Line Pressure Drop (lbs./100 Feet)
NOTE − Shaded area denotes unacceptable velocity range.
Figure 14
40
30
20
15
40
30
20
15
EXAMPLE: 10 TON UNIT
13/8 IN. O.D. LINE
3.3 PSIG DROP PER 100 FEET
2400 FPM VELOCITY
12.5
12.5
To use this chart, first find capacity (tons) on left side of chart. To find the pipe size, proceed right to the smallest pipe size. You
can then determine the pressure drop (vertical line) and velocity (diagonal lines) for the pipe size you selected. For example, for
10 ton unit, select 13/8 in. O.D. line.

