10
USER MANUAL
MAiN PAgE
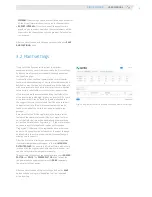
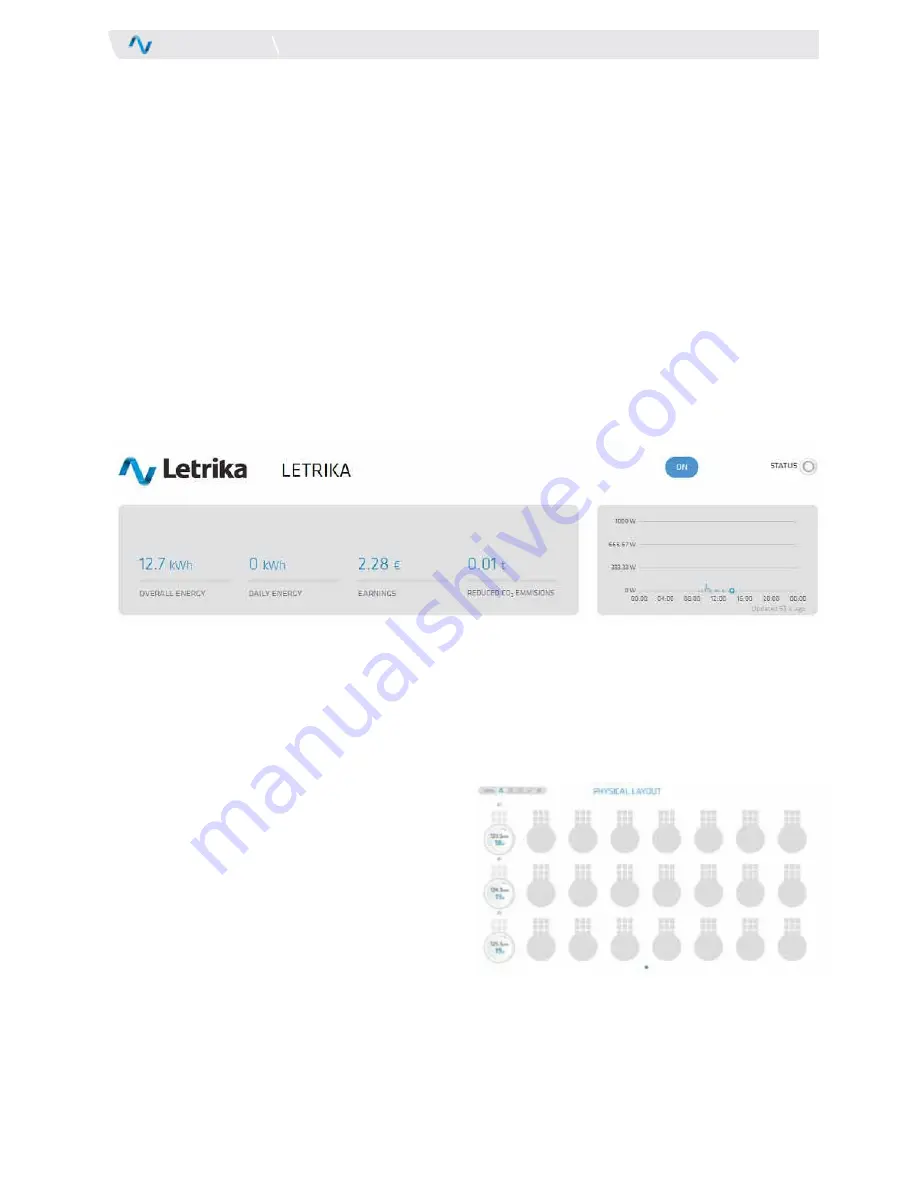
the top of the main page consists of two parts, which are both
updated every 60 seconds. the one on the left is showing numerical
informations about the quantity of the energy produced by the
power station since its installation, about the quantity of the energy
produced by the power station in a current day, about the earnings
since the power station's installation, and about the quantity of
reduced co
2
emissions since the power station's installation. the
income depends on the price setting that the user can change at the
Plant settings. the right field contains a chart showing the produced
power in a current day. clicking on the chart with the left mouse
4 Main page
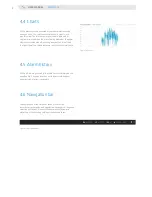
Each micro inverter is represented with a circle at the same
position as it stands in your power station. the numbers show
the produced energy and current power for each inverter, while
the number of lines and their colours show the ratio of micro
inverter output power and its status. the higher that the
number of lines is, the higher the ratio of micro inverter output
power is. if some alarm appears at the micro inverter the lines
will be coloured red and an additional box with the explanation
of the error will appear. if you click on the circle of working micro
inverter, you will be redirected to the page with panel statistics.
otherwise, if you click on the circle of the micro inverter with an
alarm you will be redirected to the Alarm history.
4.1 Physical layout
button, changes the shown data from produced power in a current
day to the produced energy in a current day. A blue dot is always
pointing at the current time at the Letrika communication gateway.
Above the field containing a chart there is an
ON/OFF
button,
which can be used when you decide to turn the power station on
or off. on its right side there is a
STATUS
light, which is coloured
green when the power station is on and coloured grey when power
station is off or when at least one of the micro inverters is sending
a warning or an alarm.
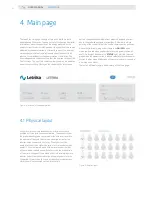
there are 5 different views to chose among at the Main page.
Figure 11: Physical layout
Figure 10: overview of the power station


