12
USER MANUAL
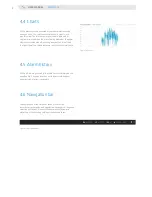
All the measurements gathered at your power station can be
seen as a chart. you can choose between daily, weekly, and
monthly view. the selection between the data gathered at
single micro inverter and the sum of data gathered at the power
station can also be made. By clicking on arrows on the left and
the right side of the shown date, you can also check history data.
All the alarms are gathered in the table. For every alarm you can
see when did it happen, on which micro inverter did it appear,
and what kind of error it represents.
the navigation bar can always be found at the Letrika
communication gateway web application. Among other language
selection and log out (if you activated username/password
protection at the gateway settings) can be made there.
4.4 charts
4.5 Alarm history
4.6 Navigation bar
Figure 14: charts
Figure 15: Navigation bar
MAiN PAgE


