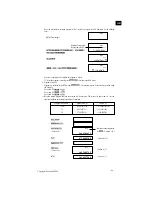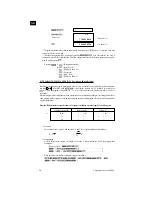
3.3 SOME GRAPHING EXAMPLES
The following examples are presented to show you some ways that the graphing functions can be used
effectively.
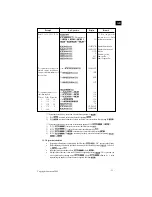
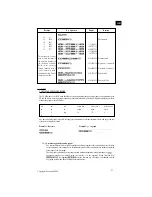
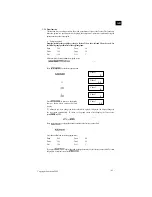
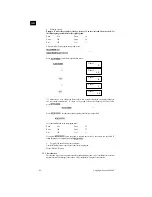
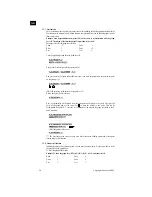
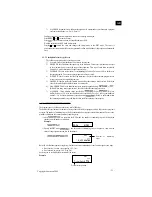
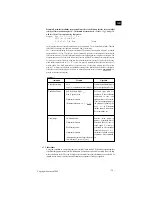
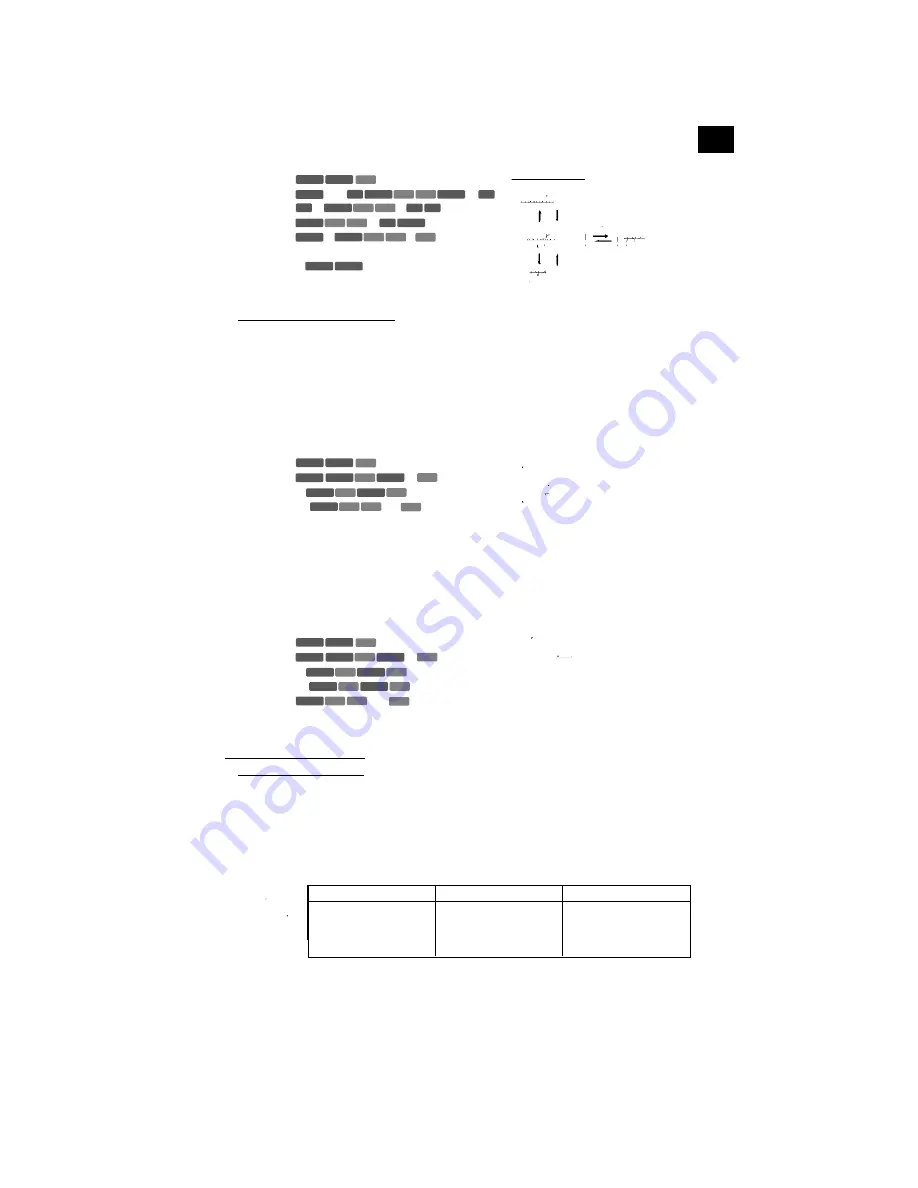
Example 1: to graph the function y=x
3
-9x
2
+27x+50
Use the following range parameters.
Xmin
:
-5
Ymin
:
-30
Xmax
:
10
Ymax
:
150
Xscl
:
2
Yscl
:
20
3
9
27 50
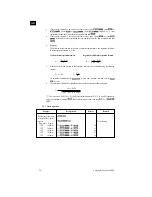
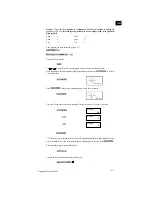
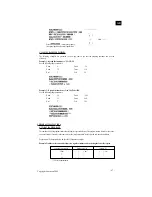
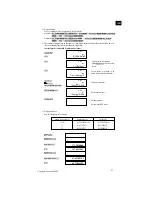
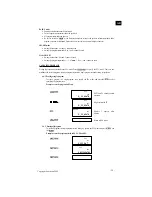
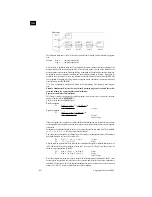
Example 2: To graph the function y=x
4
+4x
3
-36x
2
-160x+300
Use the following range parameters.
Xmin
:
-10
Ymin
:
-600
Xmax
:
10
Ymax
:
600
Xscl
:
2
Yscl
:
200
4
4
3
36 160
300
4 PROGRAM CALCULATIONS
4.1 WHAT IS A PROGRAM?
This unit has a built-in program feature that facilitates repeat calculations. The program feature is used for the conse-
cutive execution of formulas in the same way as the “multi-statement” feature is used in manual calculations.
Programs will be discussed here with the aid of illustrative examples.
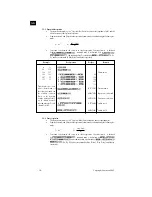
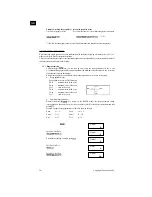
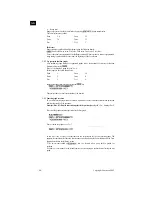
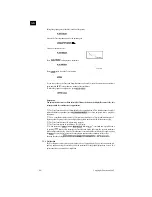
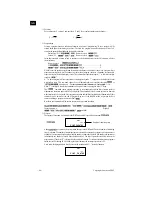
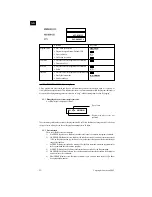
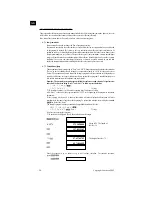
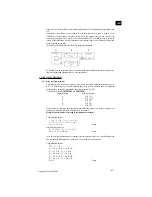
Example: Find the surface area and volume of a regular octahedron when the length of one side is given.
0.25
2
2
1
2
5
2
3
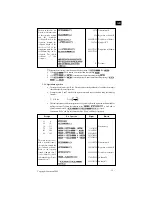
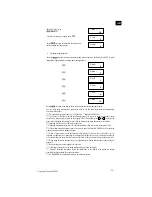
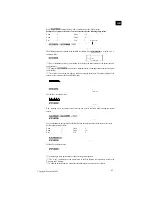
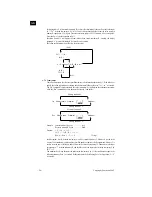
Press
to return the graph to
its original position after scroll operations.
Copyright L
EXIBOOK
2002
- 47 -
GB
EXE
SHIFT
Cls
SHIFT Zoom Org
EXE
X
ALPHA
Graph
ALPHA
(
)
+
X
ALPHA
Graph
-
X
ALPHA
:
)
-
EXE
EXE
SHIFT
Cls
X
ALPHA
x
y
Graph
-
X
ALPHA
x
2
+
X
ALPHA
+
EXE
EXE
SHIFT
Cls
X
ALPHA
x
y
Graph
+
X
ALPHA
x
y
-
X
ALPHA
x
y
-
X
ALPHA
+
X
ALPHA
(
(
)
+
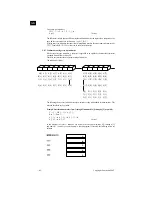
Length of one side (A)
Surface area (S)
Volume (V)
10 cm
( ) cm
2
( ) cm
3
7
( )
( )
15
( )
( )
*** Fill in the parentheses.

