OPERATION
15
ENGLISH
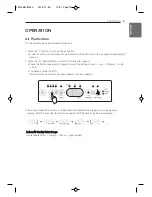
• In the example above, the PM1.0 density displays at 50 ug/m³ (a bad or orange level) and the dust particle
size LED indicator for PM1.0 is lit. This indicates that the PM1.0 level is higher than the PM10 or PM2.5
levels. If all the PM density levels are normal/good and the air quality indicator light is orange/red, the level
of odors is very high.
NOTE
• PM10 and PM2.5 density levels follow standards provided by the U.S. EPA (Environmental Protection
Agency).
- The overall air quality level displayed on the product may differ from the level announced by the EPA.
• The PM density level for PM1.0 is displayed in the same manner as the PM density level for PM2.5 (using
standards developed by LG Electronics).
• The displayed density of PM10 / PM2.5 could differ from the forecast of the EPA and from other
measurement devices or products.
- Indicated dust concentration values can differ from each other depending on the differences in dust
measuring methods and also from real dust concentration levels.
- The assessment of dust density was made against dust used for LG Electronics standards tests.
• The use of products which generate steam and micro particles (humidifiers, cooling devices, sprayers, etc.)
can change the micro dust density.
• Because the indoor air quality display shows the overall dust and odor level, it could differ from the density
value of PM10, PM2.5, and PM1.0
• Even in the same space, the PM10 density value could differ from other products due to air circulation.
• The displayed PM density value could change depending on the installation environment (including the
presence of sofas, beds, carpets, vacuum cleaners, humidity, smoke, oils, and other factors).
• The displayed density value of PM10/PM2.5/PM1.0 could change depending on the surrounding
environment (construction site, roadside, factory, etc.)
• The density of micro dust could be higher near exit doors, windows, and vents or anywhere where outside
air enters.
• Do not clean the sensor with anything but water. Doing so may cause product failure.
Indoor Air Quality Levels
h
PM density ranges from 8 to 999 in increments of 1. PM density values follow the data
sheets provided by the sensor supplier.
Overall
air quality
Red
Orange
Yellow
Green
Status
Dust density (unit
μ
g/m
3
)
Odor density
PM 10
PM 2.5
PM 1.0
Odor
Very Bad
Equal or above
255
Equal or above
56
Equal or above
56
Strong
Weak
Bad
155~254
36~55
36~55
Normal
55~154
13~35
13~35
Good
0~54
0~12
0~12
↕
1,MFL68181320,영영 2016. 10. 26. 영영 10:37 Page 15

