Introduction
The LI-8150 is a robust and simple to use multiplexer
designed to interface up to sixteen soil CO
2
flux cham-
bers with the LI-8100A Automated Soil CO
2
Flux
System. Here we describe considerations for construct-
ing a multiplexed system for measuring CO
2
evolution
in flasks utilizing the LI-8100A and LI-8150. We com-
plete this example by demonstrating a twelve flask
system used to measure respiration of detached fruit.
Flask Volume, Mixing and Flow
Considerations
Volume
The LI-8100A operates as a closed system, determining
CO
2
flux from the change in CO
2
mole fraction over
time in a fixed volume. In its simplest form (ignoring
dilution due to water vapor and not standardizing the
rate for sample area or mass) the relationship between
carbon flux and the change in CO
2
mole fraction with
time takes the following form
F
PV
RT
dC
dt
=
(1)
where F is the flux in
μ
mol s
-1
, P is pressure in kPa, V is
the system volume in liters, R is the ideal gas constant, T
is temperature in K, and dC/dt is the change in CO
2
mole fraction with time (
μ
mol mol
-1
s
-1
). At ambient
pressure, system volume is the single largest factor
controlling the relationship between dC/dt and flux.
Given the same flux, changing the gas temperature from
20 to 40
°
C will only change dC/dt by about 7%, while
doubling the system volume will cut dC/dt nearly in half
because the increased volume serves to dilute the change
in CO
2
mole fraction within the system. As dC/dt
decreases, the potential for error in the measurement
due to instrument noise increases. For the LI-8100A this
noise is known and its effects have been modeled over a
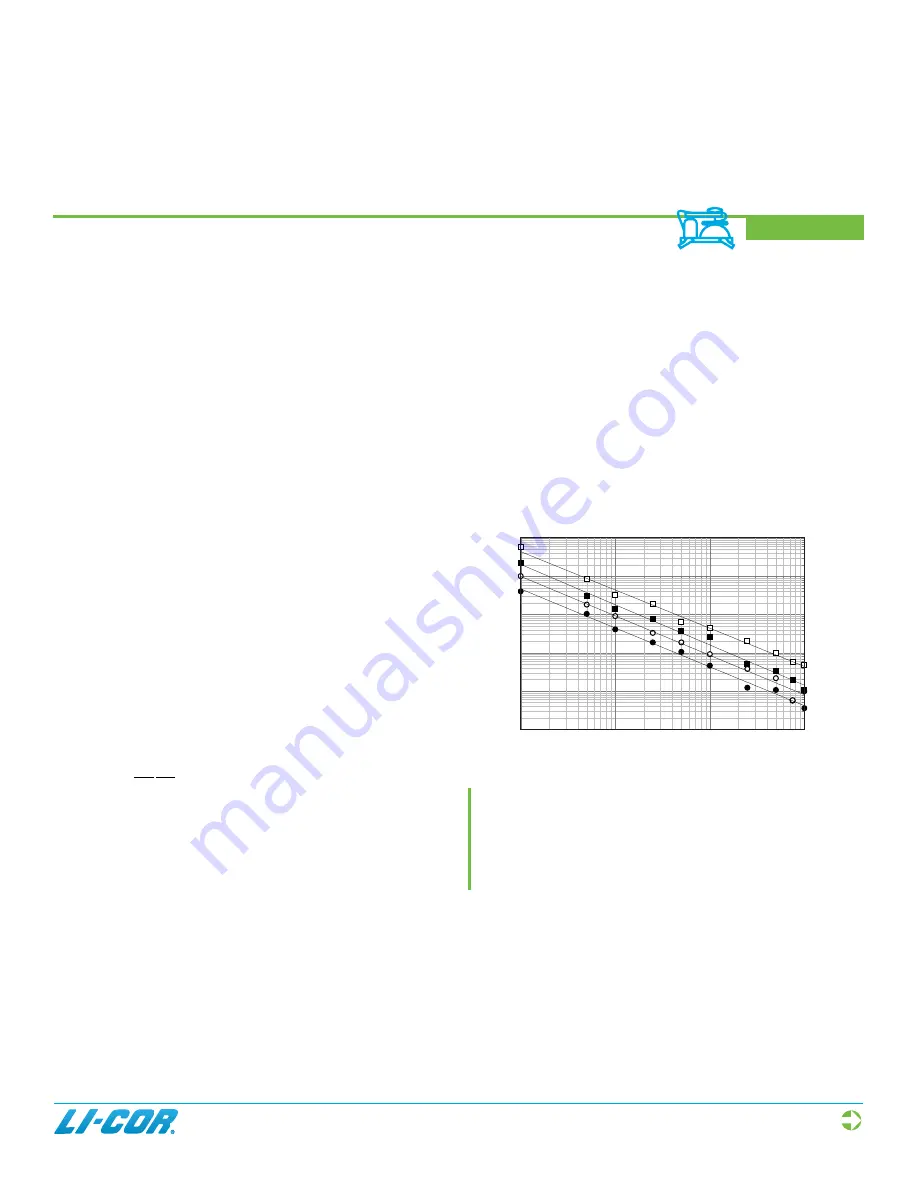
range of dC/dt for various sampling periods (Figure 1).
A chamber volume should be chosen that over the range
of expected fluxes, ensures dC/dt is large enough to be
outside the influence of instrument noise. In circum-
stances where there are constraints on chamber size, the
observation length used by the LI-8100A can be adjusted
to improve the estimate of dC/dt, as increasing the
number of data points used in the calculation will de-
crease the effect of noise (Figure 1).
Figure 1.
The relationship between potential measurement
error due to instrument noise and the change in CO
2
mole
fraction with time. Lines are fit to data modeled over 60
(open boxes), 120 (closed boxes), 180 (open circles) and
300 (closed circles) second sampling periods (i.e.,
observation length minus the deadband).
Figure 2 shows the relationship between dC/dt and the
flux for several chamber volumes at standard temperature
and pressure. This, and the information in Figure 1, can
be used as guides for selecting an appropriate chamber
volume and observation length when designing an
experiment.
dC/dt (µmol mol
-1
s
-1
)
Fractional Error
0.001
0.01
0.1
1
1.000
0.100
0.010
0.001
0.000
Measurement of CO
2
Evolution
in a Multiplexed Flask System
Continued on next page
App. Note 127


