17
Method:
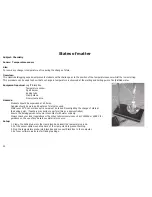
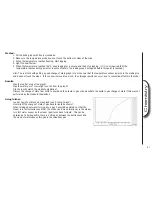
1. Start the datalogging software.
2. Using a pipette, drop water onto the paper wrapped around the temperature sensor until it is saturated.
3. Continue logging the temperature for about 3 minutes.
4. Remove the paper from the probe and wipe dry using a paper towel.
5. Allow the temperature of the probe to reach the starting temperature of the water sample.
6. Fold another strip of paper in half and place it onto the end of the mounted temperature sensor as before.
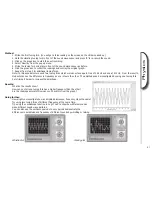
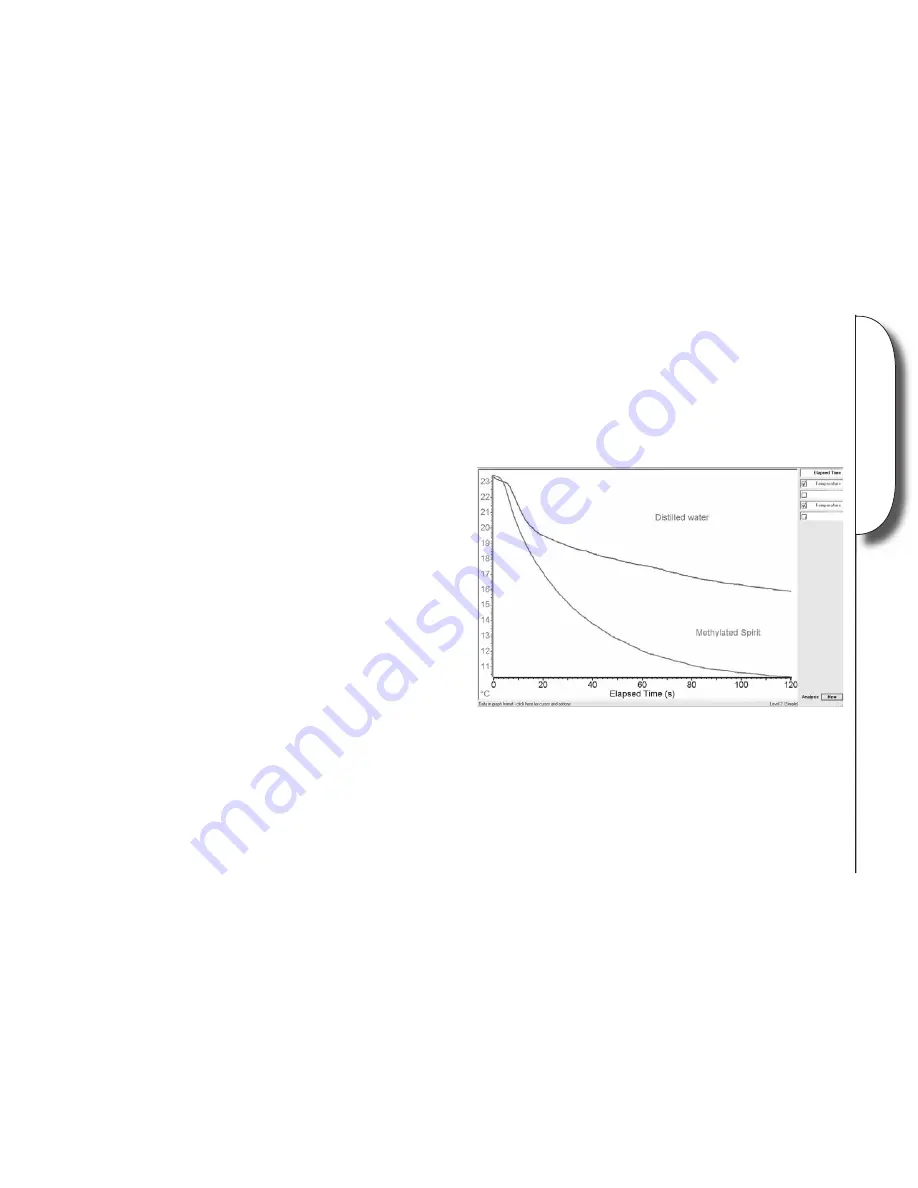
7. Start the datalogging software again and use the ‘overlay’ function to plot over the top of the previous graph.
8. Repeat step 1 above using the spirit in place of water.
Results:
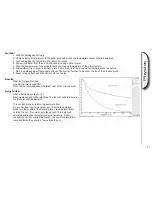
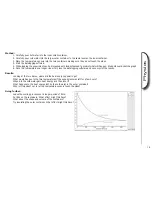
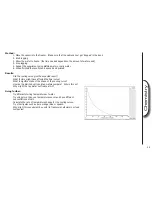
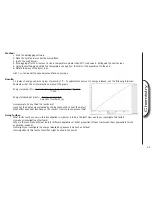
What do the results show?
How do the two traces differ?
What can be concluded about the latent heat of the two samples?
Going further:
What other liquid could you try?
What would happen to the latent heat if a fan was used to blow air
continuously over the sample?
This can also make an interesting demonstration:
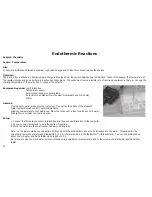
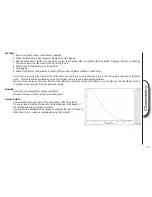
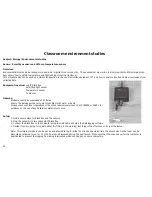
On a sunny day, invert a clay plant pot. Insert a temperature
probe into the middle of the pot and place a temperature sensor
outside the pot. Pour water onto the pot until it is fairly well
saturated and log the temperature over a few hours. Direct
sunlight is best. What might be found? You can also place a few
ice cubes inside the pot and a few outside the pot.
Physics


