21
Method:
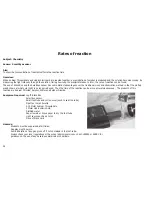
1. Strike the fi rst tuning fork. (You will get a false reading on the screen as the strike is picked up)
2. Hold the vibrating tuning fork in front of the sound wave sensor and press ‘R’ to re-record the sound.
3. Click on the green icon to start the next recording.
4. Select ‘Overlay’ from the pop up menu.
5. Strike the tuning fork and place in front of the sound wave sensor as before.
6. Click the green icon to collect the readings and overlay the original graph.
7. Repeat from step 3 for additional tuning forks.
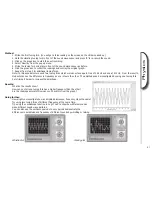
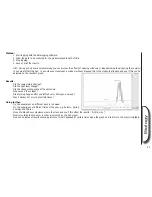
Note: In this experiment we used two tuning forks which were an octave apart. One of 256 Hz and one at 512 Hz. From the results,
students can see the difference in frequency as one is twice the other. The amplitude can be investigated by using one tuning fork
but striking it harder to increase the amplitude.
Results:
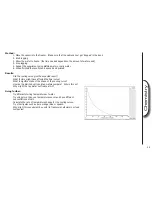
What do the results show?
How can you tell one tuning fork has a higher frequency than the other?
Are the readings accurate? How can you check this from the graph?
Going further:
How might you investigate how as amplitude increases, frequency stays the same?
Try using two tuning forks of different frequency at the same time.
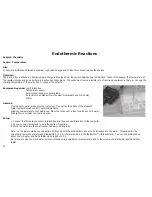
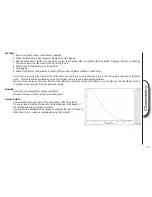
Try using the oscilloscope function in ‘LogIT Lab’ to show how different sounds
make different sound wave patterns.
You can also use the oscilloscope mode to very quickly demonstrate the
differences in amplitude and frequency of different sounds by whistling or talking.
Whistle plot
Talking plot
Physics


