23
Chemistry
Method:
1. Set your software ready to start taking readings.
2. When the temperature has reached a stable value start logging.
3. Add the Alka-Seltzer
®
tablet. (You can add a marker to the graph either by pressing the Red button if logging remotely, or selecting
the down arrow from the icons at the top of LogIT Lab)
4. Record until the temperature no longer falls.
5. Stop logging.
6. Repeat for different temperatures of water, different size or different shape of Alka-Seltzer.
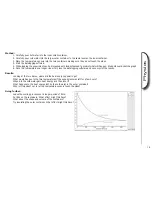
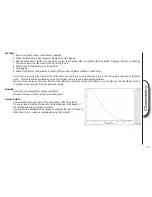
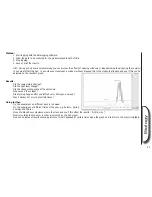
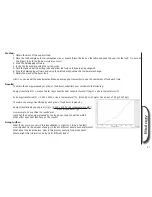
Note: If you are varying the temperature of the water, you could use more channels and record the temperature changes on the same
graph. This could also be achieved by using the ‘Overlay’ feature found in datalogging software.
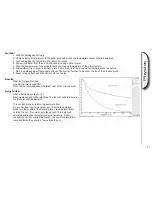
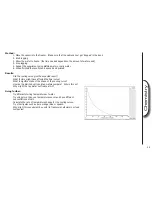
You may also need to use the zoom facility of the software to show the results more clearly. You can also use the smoothing function
to produce a cleaner curve from the gathered results.
Results:
How much of a temperature change was there?
How does this show that a reaction has taken place?
Going further:
How would the shape and size of the Alka-Seltzer affect the graph?
Try using vinegar instead of water. What might happen to the speed of
the reaction and shape of graph this time?
How might the investigation be changed to calculate the rate of reaction?
What other factors could you investigate using this method?


