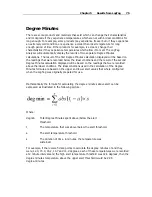
Chapter 5 Results from LogTag
69
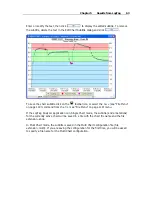
If one or more of the charts have sections with readings outside the LogTag's sensor
range, LogTag Analyzer is unable to calculate the minimum, maximum and average
values, and those sections of the graph will not be displayed. This will likely result in a
"broken" graph line, regardless of whether "show readings beyond specifications" in
the
Charts
(on page 90) section in the
Options
(see "Customizing the software" on
page 86) Window is enabled or not.
Due to the large number of calculations performed in this feature, specifically when
opening large numbers of charts spanning long periods, having the average tabs
displayed can occupy large amounts of memory and run slow. Therefore we
recommend only turning the feature on when required.
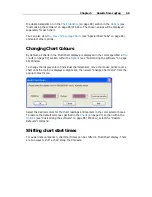
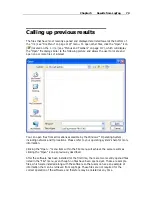
Clicking on the highlighted average tab
command will turn the average tabs off.
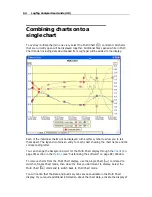
Selecting the single charts
command in the toolbar while the average charts are
active will disassemble the multi chart, and when switching back to multi chart the
average tabs will be displayed again until turned off.
Behind The Scenes
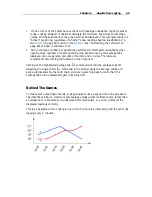
To create some meaningful results, LogTag Analyzer uses a special trend line process to
calculate the minimum, maximum and average values across multiple charts, rather than
a histogram. It is important you understand this mechanism, so you can interpret the
displayed readings correctly.
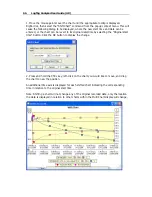
This is an example of two LogTags, one with a 5 minute log interval (A) and the other (B)
logging every 2 minutes.
Summary of Contents for Analyzer
Page 1: ...2 0...
Page 23: ...Chapter 3 Quick Start Guide 23 Only flashes if no alert condition is present...
Page 170: ......

