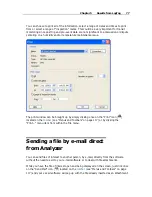
Chapter 6 Customizing the software
91
Please refer to section
How secure is my data
(on page 82) for a detailed explanation of
non-validated data.
When readings beyond the specified measurement range of a LogTag have been
recorded, the display will indicate this using the following techniques:
The Chart display will not plot the out of range values and the chart curve will appear
with broken lines.
The Data display will include "<" or ">" for each reading that is beyond the
specification range.
The Statistics display will include "**" for each statistic that includes readings that are
beyond the specification range.
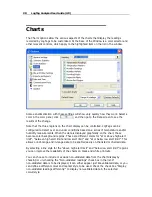
If the option "Show readings beyond specification" is enabled, all reading values will be
displayed, even if the recorded readings are beyond the operating range of the LogTag.
For example, the TRIX-8 has a published minimum temperature of -40°C. Temperatures
to -41.5°C may be displayed if the “Show readings beyond specification” is enabled,
however the accuracy of recordings between -40 and -41.5 is unknown. Temperatures
between -40 and -41.5 will be displayed even if the temperature falls to a much lower
actual value.
LogTag Recorders provides no guarantee of temperature reading reliability or accuracy
beyond the published range for a given product and the "Show readings beyond
specification" option is not recommended to be enabled for general use.
The "Elapsed Time" option switches the x-Axis display between date/time and elapsed
time since the beginning of the display period.
"Show Min/Max/Average Tab" shows up to three additional tabs in a multi chart with
graphs representing Minimum, Maximum and Average readings (See
Combining Charts
into a single chart
on page 64.)
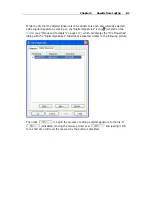
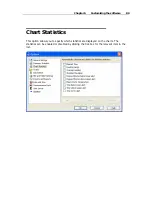
Most of the Chart Options settings can be enabled or disabled by clicking the tick box for
the relevant item in the list.
Summary of Contents for Analyzer
Page 1: ...2 0...
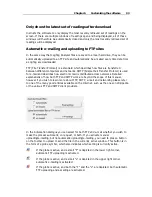
Page 23: ...Chapter 3 Quick Start Guide 23 Only flashes if no alert condition is present...
Page 170: ......

