WSDA
®
-Base-104
®
USB Base Station
User Manual
System Operational Overview
22
NOTE
When synchronized sampling is set to slower sample rates it may take several
seconds after sampling is initiated for the first sample to appear.
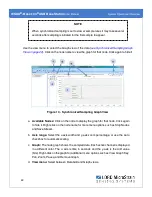
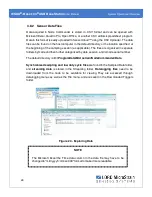
Use the view menu to select the Graph view of the data (
see Synchronized Sampling Graph
View on page 22
). Click on the node name to view the graph for that node. Click again to hide it.
Figure 13 - Synchronized Sampling Graph View
a.
Available Nodes:
Click on the node to display the graph for that node. Click again
to hide it. Right-click on the node name for more menu options such as Stop Nodes
and Save Stream.
b.
Axis range:
Select the
x
-axis width and
y
-axis zoom percentage, or use the Auto
check box for automatic scaling.
c.
Graph:
The node graph shows the sampled data. Each active channel is displayed
in a different color. The
x
-axis is time in seconds and the y-axis is the A/D value
(bits). Right-click on the graph for additional menu options such as View Graph Key,
Pan, Zoom, Pause, and Remove Graph.
d.
View menu:
Select between Data Grid and Graph views.

