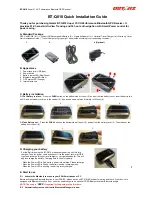

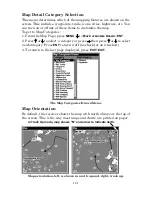
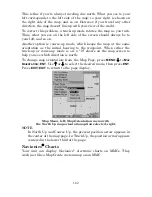
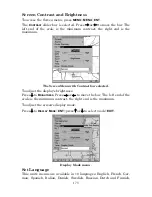
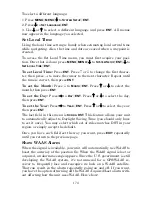
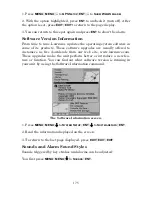
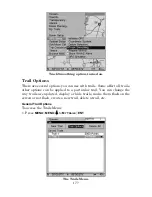
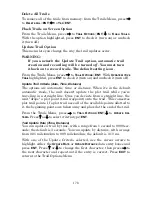
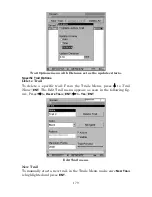

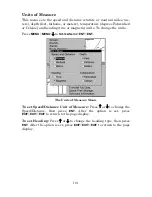

167
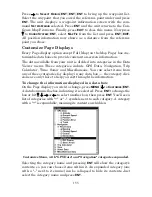
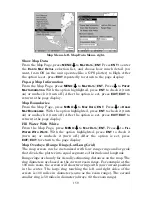
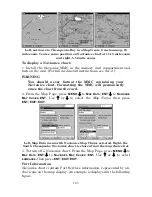
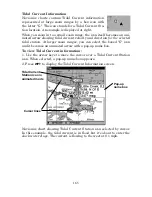
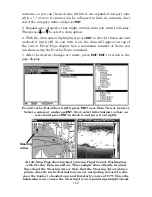
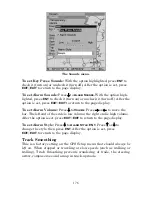
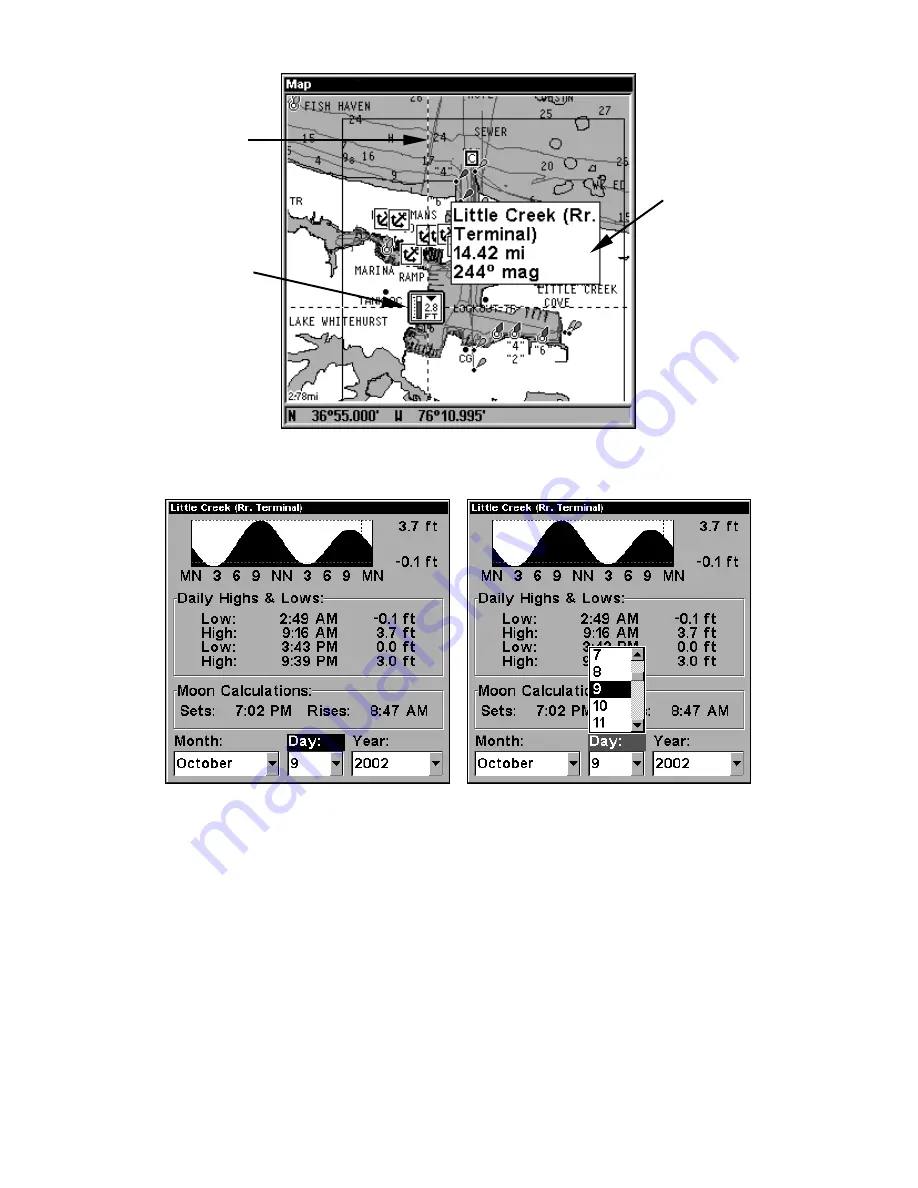
Navionics chart showing Tide Station icon selected by cursor.
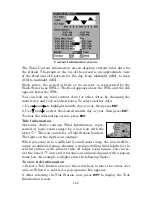
In the example above, the tide is at 2.8 feet and falling,
as shown by the down arrow at the top of the icon.
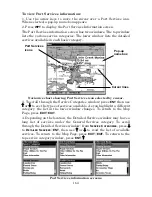
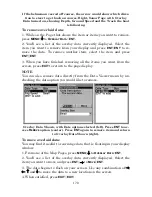
Tide Information screen.
The Tide Information screen displays daily tidal data for the station.
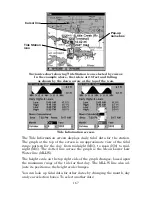
The graph at the top of the screen is an approximate view of the tidal
range pattern for the day, from midnight (MN), to noon (NN) to mid-
night (MN). The dotted line across the graph is the Mean Lower Low
Water line (MLLW).
The height scale on the top right side of the graph changes, based upon
the maximum
range
of the tide for that day. The MLLW line also ad-
justs its position as the height scale changes.
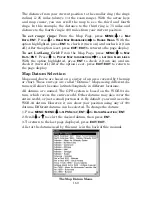
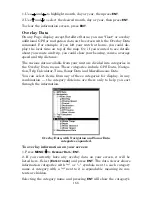
You can look up tidal data for other dates by changing the month, day
and year selection boxes. To select another date:
Tide Station
icon
Cursor line
Pop-up
name box
Summary of Contents for LMS-332C
Page 20: ...12 Notes ...
Page 52: ...44 Notes ...
Page 61: ...53 Notes ...
Page 68: ...60 Notes ...
Page 106: ...98 Notes ...
Page 110: ...102 Notes ...
Page 190: ...182 Notes ...
Page 208: ...200 Notes ...
Page 212: ...204 Notes ...
Page 213: ...205 Notes ...