19
the bottom when it’s in the
manual mode.
MENU - PAGE 1
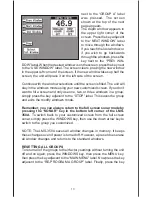
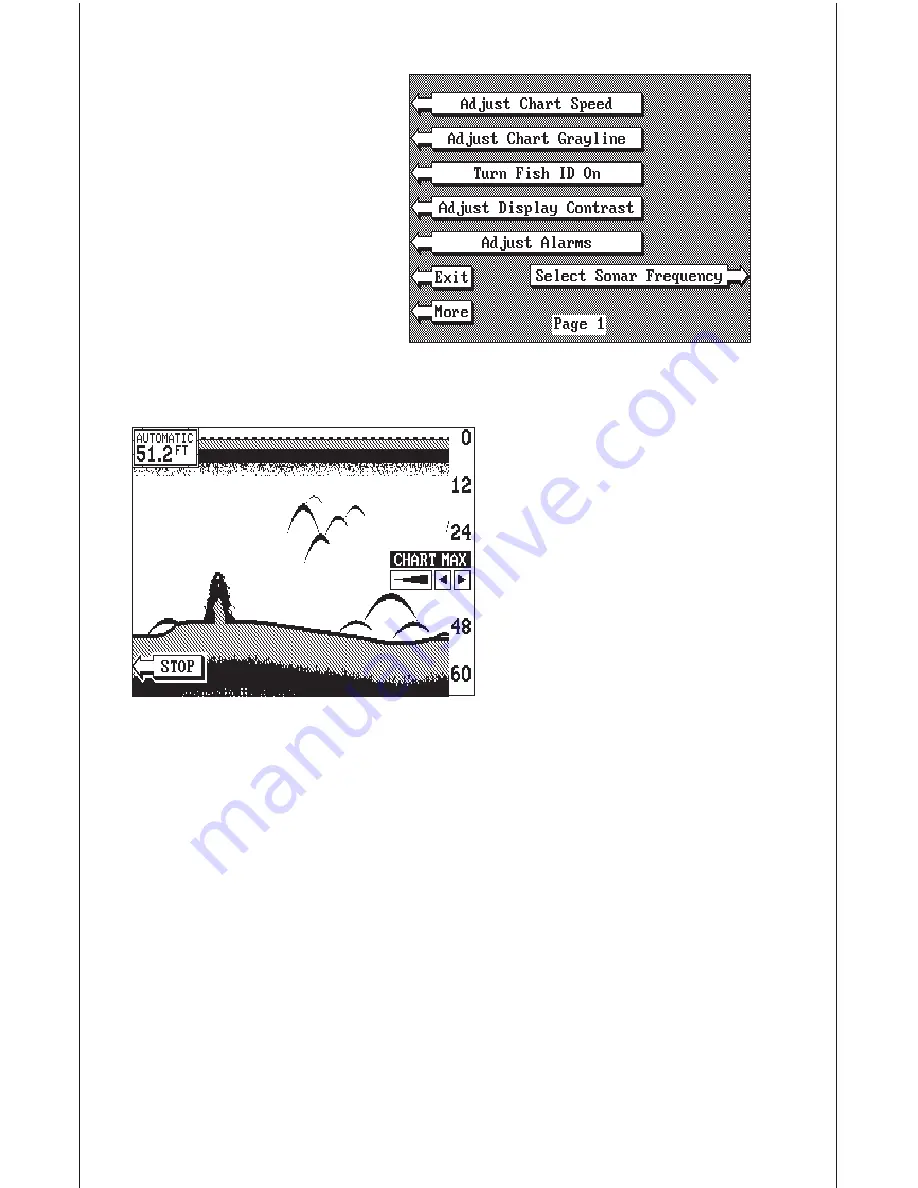
CHART SPEED
The rate echoes scroll across
the screen is called the chart
speed. It’s adjustable by first
pressing the menu key, then
pressing the key adjacent to
the “Adjust Chart Speed” label.
The chart speed menu appears
on the right side of the screen. Increase the chart speed by pressing the
right arrow key or decrease it
by pressing the left arrow key.
The percentage of chart speed
in use changes as the arrow
keys are pressed. The bar chart
also gives a graphical indica-
tion of the chart speed. You
can see the change on the
screen (both on the menu and
on the chart record) as you
press the keys. After you’ve
made the adjustment, press
the CLR key to erase the menu.
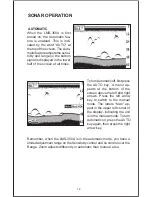
To stop the chart, press the key adjacent to the “STOP” label in the unit’s
lower left corner. To start the chart, press the key next to the “START"
label.
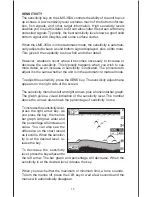
GRAYLINE
®
GRAYLINE lets you distinguish between strong and weak echoes. It
“paints” gray on targets that are stronger than a preset value. This allows
you to tell the difference between a hard and soft bottom. For example, a
soft, muddy or weedy bottom returns a weaker signal which is shown with
a narrow or no gray line. A hard bottom returns a strong signal which
causes a wide gray line.
If you have two signals of equal size, one with gray and the other without,
then the target with gray is the stronger signal. This helps distinguish
weeds from trees on the bottom, or fish from structure.
Summary of Contents for LMS-350A
Page 1: ...INSTALLATION AND OPERATION INSTRUCTIONS LMS 350A ...
Page 4: ......
Page 49: ...45 GROUP H GROUP I GROUP M GROUP L GROUP O GROUP N GROUP K GROUP J ...
Page 50: ...46 GROUP P GROUP Q GROUP U GROUP T GROUP V GROUP S GROUP R ...
Page 52: ...48 WINDOW 13 WINDOW 12 WINDOW 15 WINDOW 14 WINDOW 11 WINDOW 10 WINDOW 9 WINDOW 8 ...
Page 53: ...49 WINDOW 21 WINDOW 20 WINDOW 19 WINDOW 18 WINDOW 17 WINDOW 16 ...
Page 92: ...89 This page intentionally left blank ...
Page 93: ...90 LITHO IN U S A 988 0133 01 ...


