8. Maintenance and Inspection
8-11
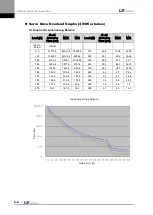
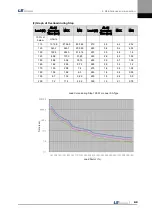
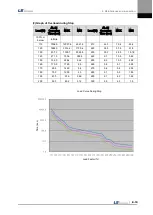
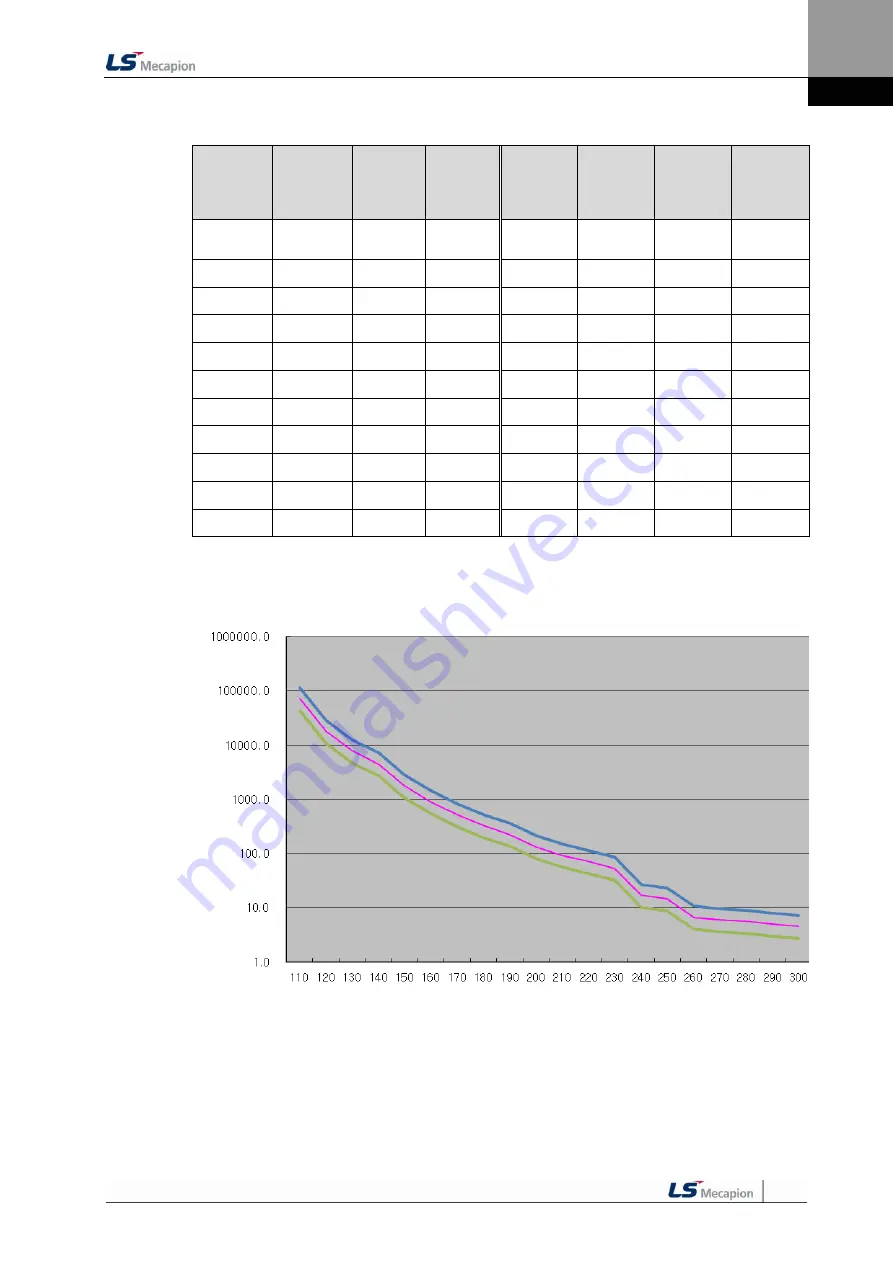
(2) Graph of Overload during Stop
Load (%)
AL-21
Occurrin
g Time
(sec)
MAX
MIN
Load (%)
AL-21
Occurrin
g Time
(sec)
MAX
MIN
100% or
below
Infinite
110
72512.0 116019.2 43507.2
210
93.4
149.4
56.04
120
18128.0 29004.8 10876.8
220
71.8
114.9
43.08
130
8056.9 12891.0 4834.14
230
53.7
85.9
32.22
140
4532.0
7251.2
2719.2
240
17.2
27.5
10.32
150
1770.0
2832.0
1062
250
14.7
23.5
8.82
160
898.4
1437.4
539.04
260
6.7
10.7
4.02
170
521.8
834.9
313.08
270
6.0
9.6
3.6
180
334.1
534.6
200.46
280
5.7
9.1
3.42
190
226.0
361.6
135.6
290
5.0
8.0
3
200
134.0
214.4
80.4
300
4.6
7.4
2.76
Load Curve during Stop
Load Factor (%)
T
im
e
(
s
e
c
)
Summary of Contents for L7 A001
Page 1: ...VER 1 5...
Page 2: ......
Page 32: ...1 Product Components and Signals 1 20...
Page 38: ...2 Installation 2 6...
Page 54: ......
Page 188: ...7 Product Specifications 7 26 L7 A020 L7 A035 Weight 2 5 kg cooling fan included...
Page 210: ...8 Maintenance and Inspection 8 14...
Page 211: ...9 Appendix 9 1 9 Appendix...
Page 218: ...9 Appendix 9 8...
Page 221: ......
Page 222: ......

