Insert | Chart
CentreVu Report Designer Version 8 User Guide
Introduction
8-1
8 Insert | Chart
Introduction
8
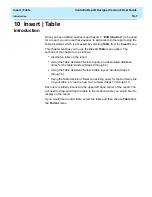
Once you have defined queries (see Chapter 7, “Edit | Queries”) to be used
for a report, you can use those queries to add a chart to your report using the
Chart Assistant, which is accessed by selecting Chart from the Insert menu.
This chapter includes the following sections:
●
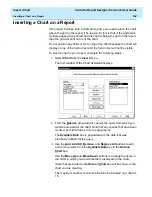
Inserting a chart on the report
●
Using the Chart Assistant “Select the query and data items you wish to
plot on the chart” window (Steps 2 through 4)
●
Using the Chart Assistant “Specify a chart type” window (Steps 5
through 9)
●
Using the Chart Assistant “Make category and series selections”
window (Steps 10 - 15).
There are two things to keep in mind when inserting charts onto the report:
●
When you insert a chart on a report, the chart is shown with sample data
to help you visualize how the chart will appear when you run the report.
●
Each item is initially inserted in the upper left hand corner of the report.
You will need to drag-and-drop the chart to the location where you
would like it to display on the report.
If you would like to edit a chart, select the chart and then choose Chart from
the Format menu.
Summary of Contents for CentreVu Report Designer
Page 4: ......
Page 18: ...Introduction CentreVu Report Designer Version 8 User Guide Related Documents 1 8...
Page 102: ...Edit Inputs CentreVu Report Designer Version 8 User Guide Viewing the Input Window 6 16...
Page 198: ...Format Text CentreVu Report Designer Version 8 User Guide Formatting Text on the Report 15 4...
Page 264: ...Index CentreVu CMS R3V8 Upgrades and Migration IN 10...
Page 266: ......

