Format | Chart
CentreVu Report Designer Version 8 User Guide
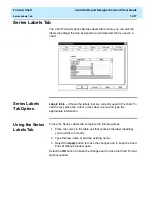
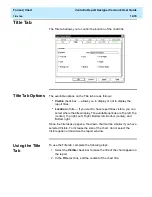
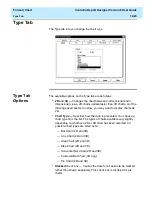
3D Effects Tab
12-22
3D Effects Tab
12
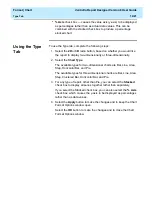
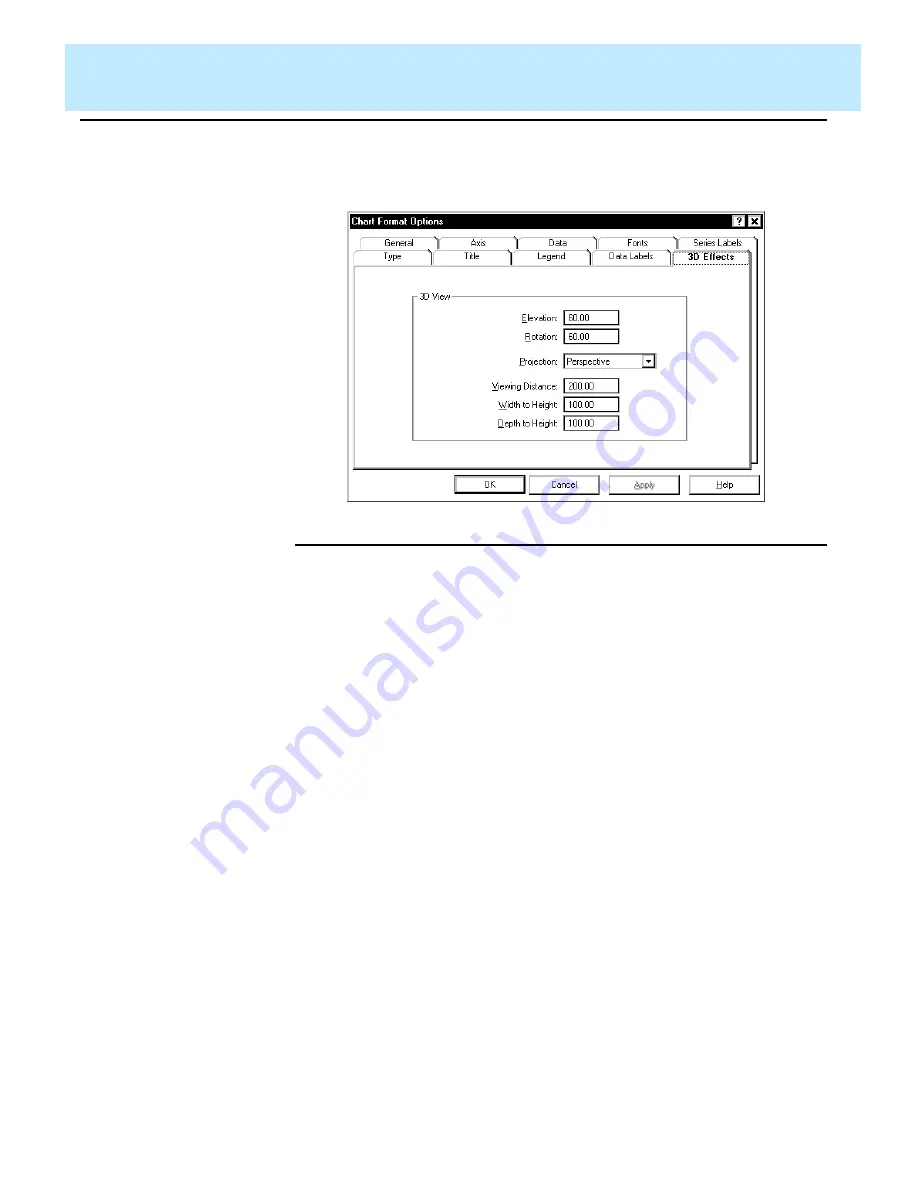
The 3D Effects tab allows you to control the 3D appearance of the chart.
If the current chart is a 2D chart, this tab is disabled.
3D Effects Tab
Options
12
The following parameters can be changed:
●
Elevation — This is a number from 0 through 90 degrees, and
describes the relative height from which a chart is viewed. An
elevation of 90 looks directly down on the top of the chart, while an
elevation of 0 looks directly at the side of the chart. The example
charts throughout this document use an elevation of 30 degrees.
●
Rotation — This is a number from -360 through 360 degrees, and
specifies the angle that the chart is turned relative to the viewing
position. The example charts throughout this document use a
rotation of 60 degrees. Rotation does not apply to 3D pie charts.
Summary of Contents for CentreVu Report Designer
Page 4: ......
Page 18: ...Introduction CentreVu Report Designer Version 8 User Guide Related Documents 1 8...
Page 102: ...Edit Inputs CentreVu Report Designer Version 8 User Guide Viewing the Input Window 6 16...
Page 198: ...Format Text CentreVu Report Designer Version 8 User Guide Formatting Text on the Report 15 4...
Page 264: ...Index CentreVu CMS R3V8 Upgrades and Migration IN 10...
Page 266: ......


