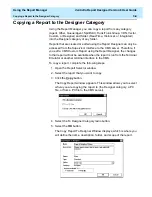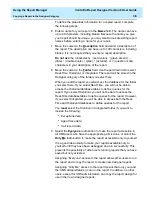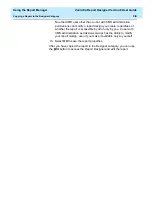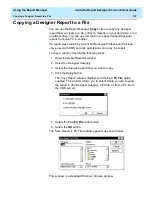
Using the Report Wizard
CentreVu Report Designer Version 8 User Guide
Creating a New Report
2-23
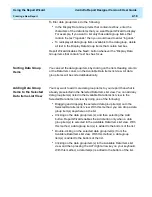
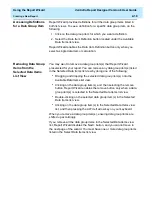
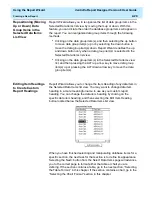
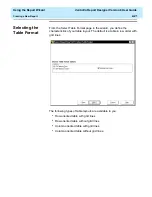
To choose a format for your table, do the following:
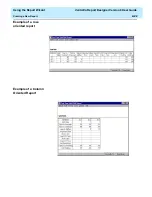
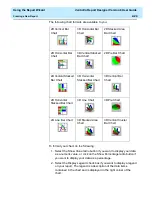
1. Select the Fill Table by Row radio button if you want your report to
have a row format, or select the Fill Table by Column radio button if
you want your report to have a column format.
2. Select the Display Grid Lines check box if you want grid lines to
separate the data on your report.
3. Select Next> to advance to the next page of the wizard. The Preview
page appears. Go to the next section, “Previewing the Report,” on
in this chapter.
Selecting the Chart
Format
2
From the Select Chart Format page in the wizard, you define the format
of your chart. The default is a vertical 2D bar chart that displays the data
by value.
Summary of Contents for CentreVu Report Designer
Page 4: ......
Page 18: ...Introduction CentreVu Report Designer Version 8 User Guide Related Documents 1 8...
Page 102: ...Edit Inputs CentreVu Report Designer Version 8 User Guide Viewing the Input Window 6 16...
Page 198: ...Format Text CentreVu Report Designer Version 8 User Guide Formatting Text on the Report 15 4...
Page 264: ...Index CentreVu CMS R3V8 Upgrades and Migration IN 10...
Page 266: ......

