Insert | Chart
CentreVu Report Designer Version 8 User Guide
Inserting a Chart on a Report
8-2
Inserting a Chart on a Report
8
If the report includes both a chart and a grid, you need to place the chart
above the grid on the report. The reason for this is that, if the grid spans
multiple pages when printed and the chart is below the grid on the report,
then the grid will print on top of the chart.
Do not position any fields or text on top of the chart because the chart will
display on top of the field or text and the field or text will not be visible.
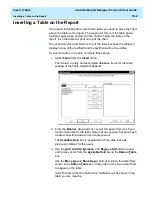
To insert a chart in your report, complete the following steps:
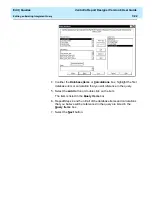
1. Select Chart from the Insert menu.
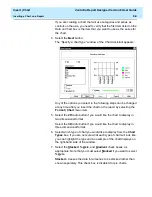
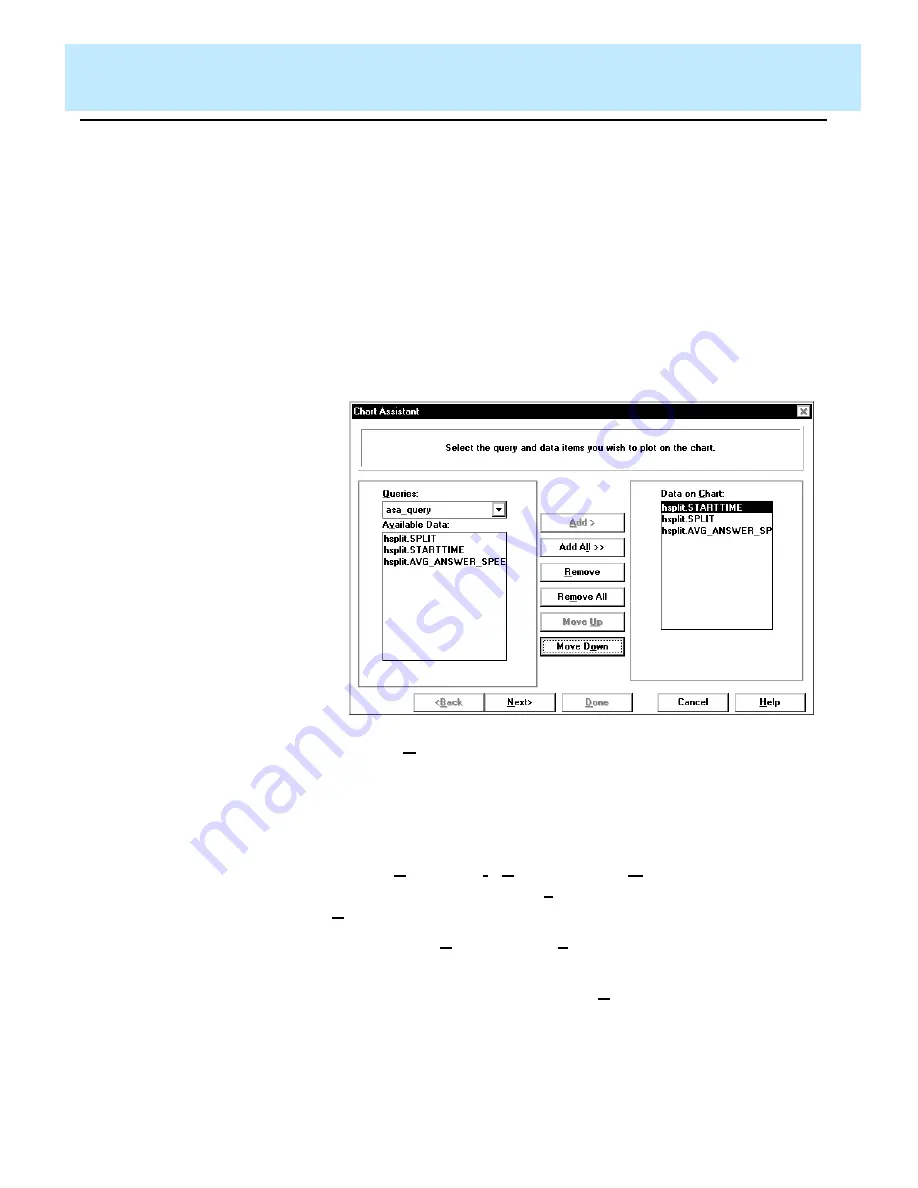
The first window of the Chart Assistant displays:
2. From the Queries drop-down list, select the query from which you
want to take data for the chart. Note that any queries that have been
created, but still include errors are grayed-out.
The Available Data box is populated with the data that was
previously defined for the query.
3. Use the Add, Add All, Remove, and Remove All buttons to add
and remove items from the Available Data box to the Data on
Chart box.
Use the Move Up and Move Down buttons to arrange the items in
the order in which you would like them displayed on the chart.
Items that are added to the Data on Chart box will be shown in the
chart you are creating.
The maximum number of columns that can be included on a chart is
16.
Summary of Contents for CentreVu Report Designer
Page 4: ......
Page 18: ...Introduction CentreVu Report Designer Version 8 User Guide Related Documents 1 8...
Page 102: ...Edit Inputs CentreVu Report Designer Version 8 User Guide Viewing the Input Window 6 16...
Page 198: ...Format Text CentreVu Report Designer Version 8 User Guide Formatting Text on the Report 15 4...
Page 264: ...Index CentreVu CMS R3V8 Upgrades and Migration IN 10...
Page 266: ......

