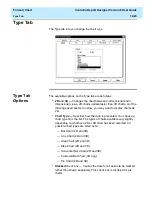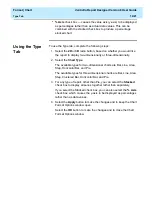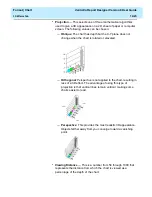
Format | Chart
CentreVu Report Designer Version 8 User Guide
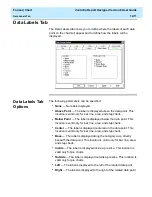
Data Labels Tab
12-12
If data point labels are displayed, you can specify that they include one of
the following:
●
Value — The value of the data point appears in the label.
●
Percent — The value of the data point appears in the label as a
percentage.
●
Series Name — The series name is used to label the data point.
●
Category Name — The category name is used to label the data
point.
The position of data point labels can affect the readability of the chart.
The label text may overlap in some situations, making it difficult or
impossible to read the labels.
Using the Data
Labels Tab
12
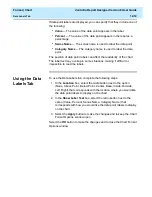
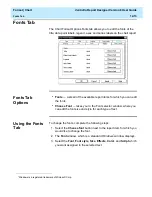
To use the Data Labels tab, complete the following steps:
1. In the Location box, select the radio button next to the option
(None, Above Point, Below Point, Center, Base, Inside, Outside,
Left, Right) that corresponds with the location where you would like
the data point labels to display on the chart.
2. In the Show Label Text box, select the radio button next to the
option (Value, Percent, Series Name, Category Name) that
corresponds with how you would like the data point labels to display
on the chart.
3. Select the Apply button to make the changes and to keep the Chart
Format Options window open.
Select the OK button to make the changes and to close the Chart Format
Options window.
Summary of Contents for CentreVu Report Designer
Page 4: ......
Page 18: ...Introduction CentreVu Report Designer Version 8 User Guide Related Documents 1 8...
Page 102: ...Edit Inputs CentreVu Report Designer Version 8 User Guide Viewing the Input Window 6 16...
Page 198: ...Format Text CentreVu Report Designer Version 8 User Guide Formatting Text on the Report 15 4...
Page 264: ...Index CentreVu CMS R3V8 Upgrades and Migration IN 10...
Page 266: ......

