© PROPERTY OF LUNDIX IT SWEDEN, ALL RIGHTS RESERVED – THE DISCLOSURE OR OTHER COMMUNICATION, COPYING, REPRODUCTION AND ANY USE WHATSOEVER IS FORBIDDEN WITHOUT THE WRITTEN AUTHORIZATION
OF LUNDIX IT.
SPC SmartBox User Manual
Revision
1.1
Page
52 of 62
Reference
2017-110
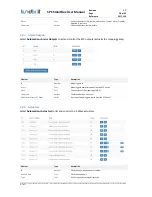
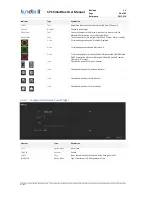
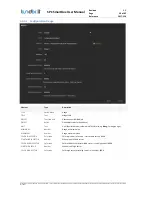
THRESHOLD VALUE
Number
Threshold value between OFF and ON state
LED ON COLOR
Color code
Color for state ON (value >= threshold value). #RGB.
ON TEXT
Text
Text state ON
6.5.7
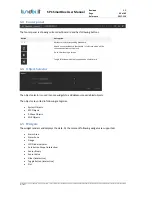
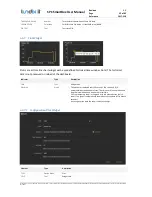
Plot Widget
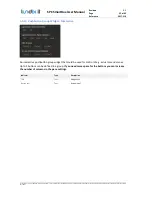
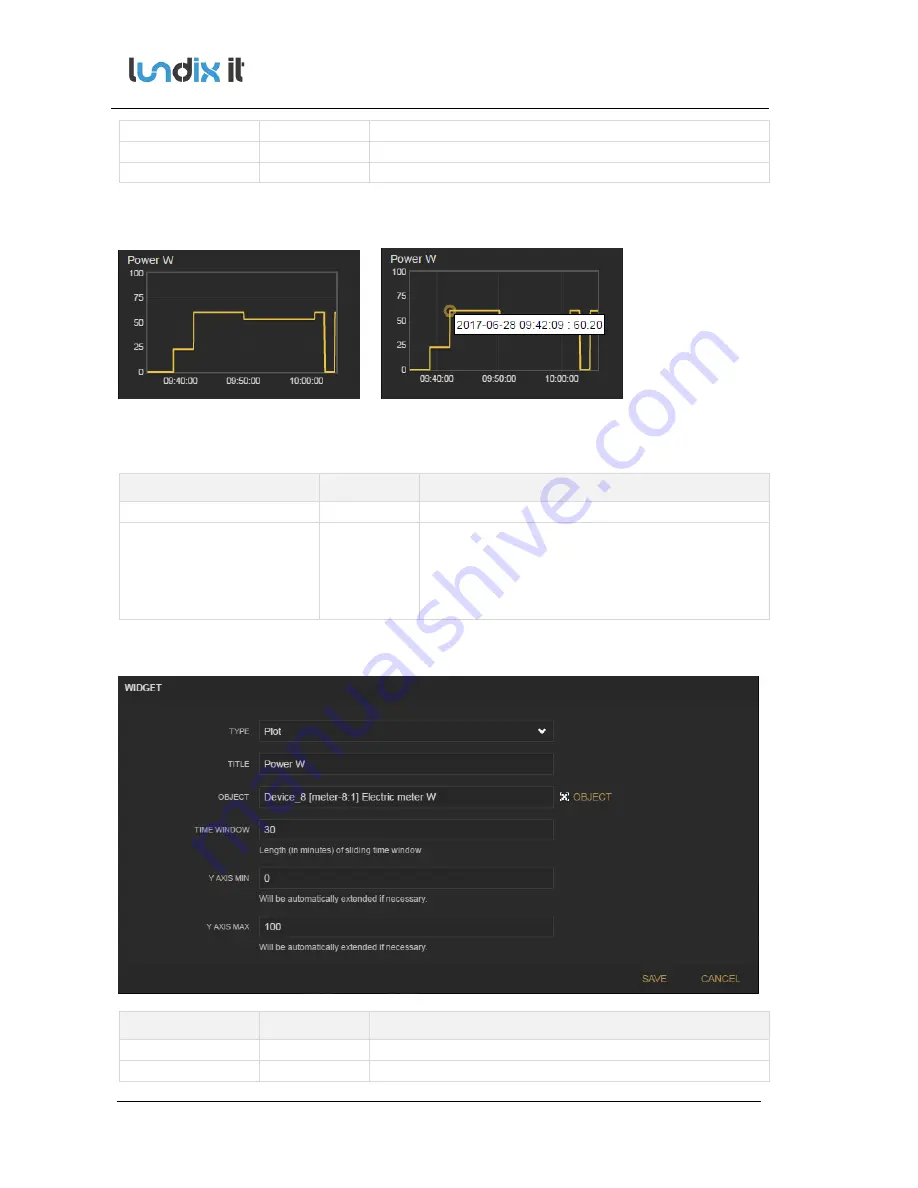
Plot is a real-time line chart widget with a predefined historical time window. Note! The historical
data is not preserved on reload of the dashboard.
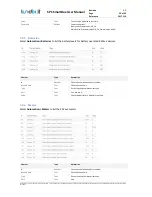
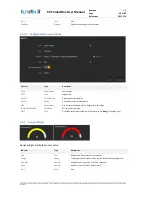
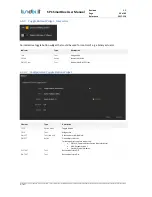
Indicator
Type
Description
Title
Text
Widget title
Plot Area
Graph
The plot data is updated every 10 seconds. The value axis (Y) is
automatically extended if necessary. The time axis (X) has a predefined
length (time window) and is updated in real-time.
You can temporary zoom in the graph with left mouse button (only X
zoom). The graph is automatically zoomed out next update (after max 10
seconds).
Hovering over the data line shows values as tooltips.
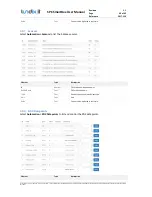
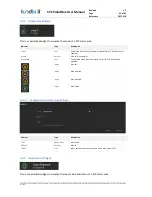
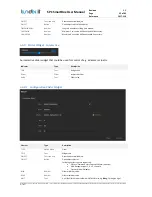
6.5.7.1
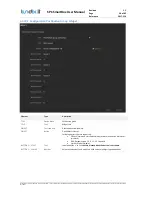
Configuration Plot Widget
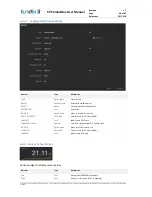
Element
Type
Description
TYPE
Option Menu
Plot
TITLE
Text
Widget title

