TEO-540-C1A Engine Maintenance Manual
© 2022 Avco Corporation. All Rights Reserved
Access the Field Service Tool
August 2022
Page 23
Field Service Tool User Manual
7.
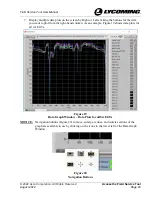
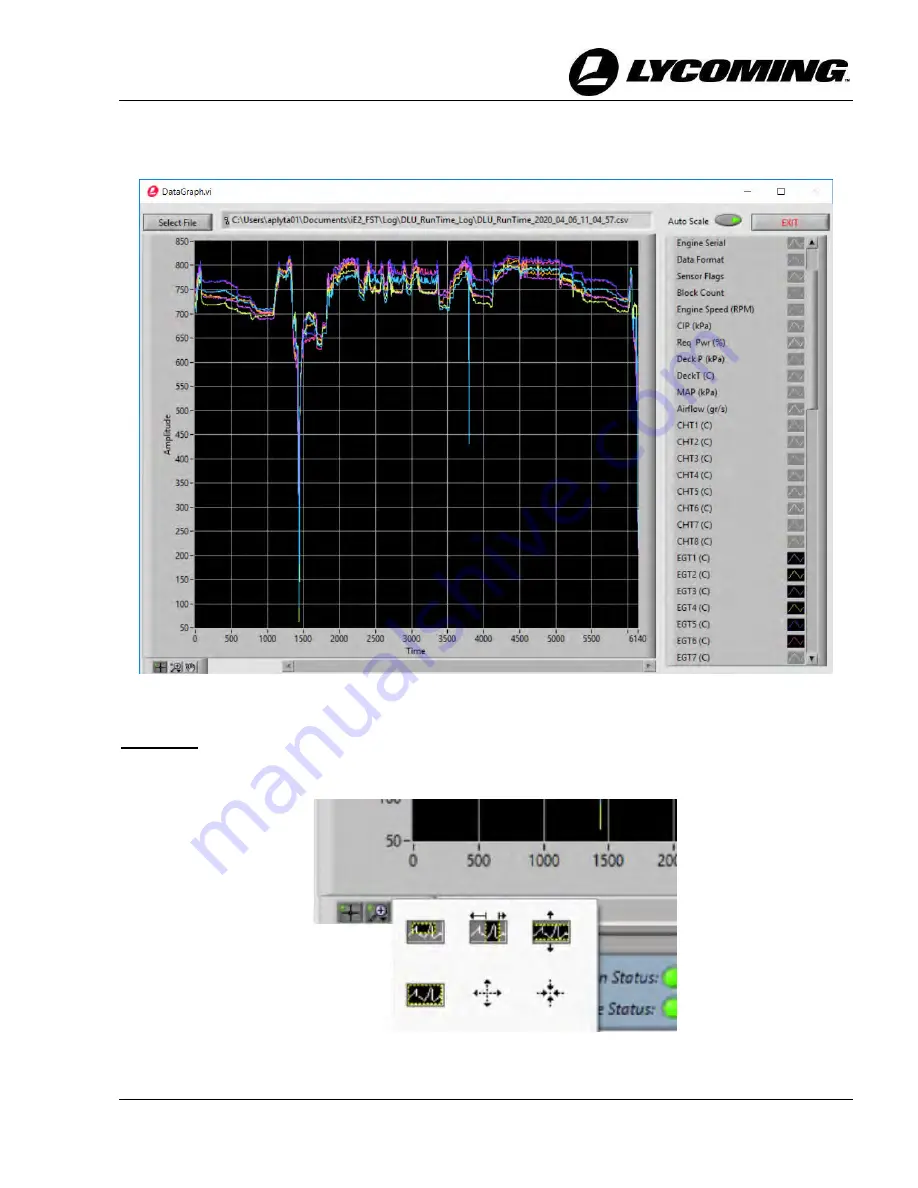
Display multiple data plots on the screen by Right or Left clicking the buttons for the data
you want to plot from the right-hand column. As an example, Figure 19 shows data plots for
all six EGTs.
Figure 19
Data Graph Window – Data Plots for all Six EGTs
NOTICE:
Navigation buttons (Figure 20) to move, enlarge, reduce, and isolate sections of the
graph are available to use by clicking on the icons in the lower left of the Data Graph
Window.
Figure 20
Navigation Buttons

