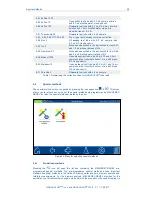
Scan
39
NANOCOLOR
®
UV
/
VIS
II and
NANOCOLOR
®
VIS
II V 1.1 / 10.2017
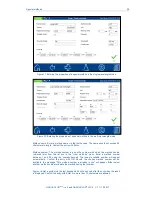
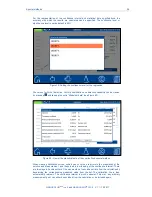
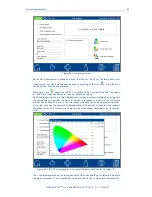
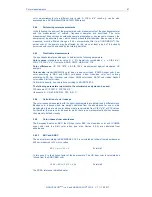
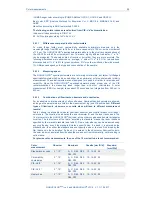
Figure 44: Scan menu
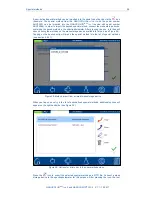
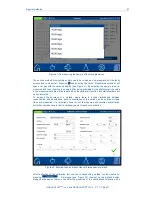
After the successful measurement of the zero solution, the sample solution needs to be
inserted. A graphic depicting the wavelengths will appear. The scan of the whole wavelength
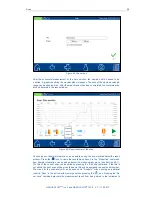
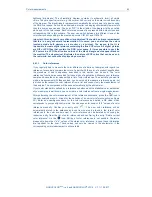
range can be observed live. After the measurement has been completed, the complete scan
will be displayed in the result window.
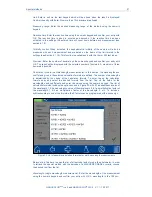
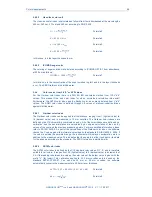
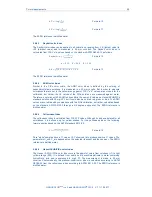
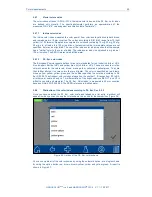
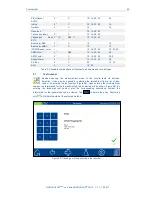
Figure 45: Result window of the scan
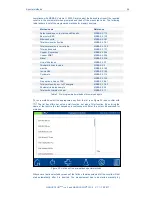
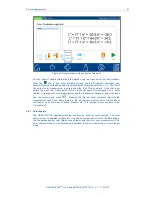
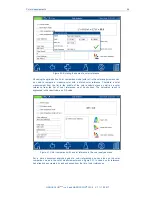
Various types of sample information can be entered using the icons located below the result
window. Press the
icon to view other available options.
Via the “Properties” command,
new sample information can be added below the measurement menu (see Section 5.2.1).
The title of the current scan can be edited by pressing
the “Edit title” command. If the title is
not edited, the next scan will be given the same title and be assigned the next serial number.
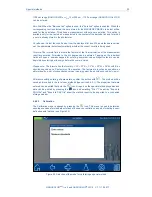
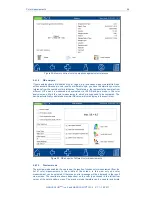
The menu for the scan analysis can be opened via
“Analysis” or by opening an individual
result in “Scan” in the instruments memory and then pressing the
icon.
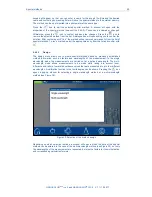
Pressing the
“Do
not s
ave” command prevents the measurement result from being stored in the instrument’s
Summary of Contents for NANOCOLOR UV/VIS II
Page 1: ......

