IQC
74
NANOCOLOR
®
UV
/
VIS
II and
NANOCOLOR
®
VIS
II V 1.1 / 10.2017
The result of the measurement will be displayed upon completion of the test. For each
wavelength, the mean detector value
I
and the standard deviation
of the scattering of
detector values are given. Furthermore, the largest absolute difference between two values
is given as
. The user specifies the test criteria for passing or failing the signal test. Via the
icon, the result of the test can be printed as a certificate or stored in the form of a CSV-
and PNG-file on an external storage medium.
6.6.2
Standard measurement
Standard measurements are used to check your own work and that of the photometer and
analytical accessories. Standards are available for purchase in the form of standard and
spiking solutions (see also www.mn-net.com).
Press the
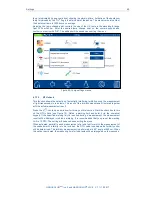
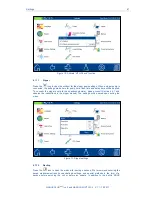
icon to open the window for specifying the desired standards (see Figure 94).
Select the entry
“Standard” to open the list of pre-defined standards in the device. Now either
the desired standard can be selected from this dynamic list or a new standard can be defined
via the
icon.
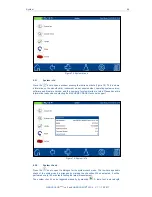
Figure 91: Entering the data for measuring a standard
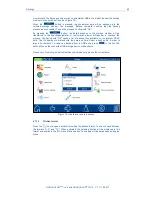
After selecting a pre-defined standard, the remainder of the fields will be filled in with the
values for method, submethod, cuvette, reference value, and confidence interval. Entering
the LOT for test kit and standard via the text keypad and then confirming with
will open
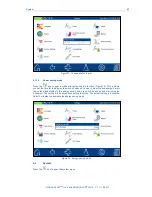
the measurement window. After inserting the appropriate sample solution and confirming
with
, the measurement will be carried out and the result will be displayed as shown in
Figure 92. The result will be given a
“Passed” (green) or “Failed” (red) rating in the upper
right corner. The measured value is compared against the reference value of the standard
solution.
Summary of Contents for NANOCOLOR UV/VIS II
Page 1: ......

