Manual
GA-60
5.3.2.1. Results screen number 4
The number 4 results screen is specific because some measurement results can
be presented graphically. Functions available for function keys are also different on this
screen.
Drawing 9.
Example of a graph on results screen 4.
Y (vertical) axis displays value of the variable. X (horizontal) axis displays time,
last 180 seconds of the measurement. Results are presented by the curve on the graph.
Name of the variable, its number and unit are displayed on the right side of the
graph.
Description of function keys available on the Results screen number 4:
M+
(+)
– change presented gas channel to the next one.
(-)
– change presented gas channel to the previous one.
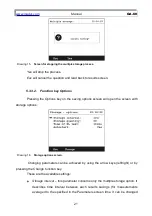
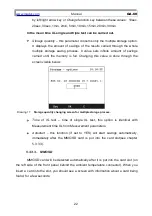
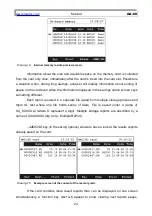
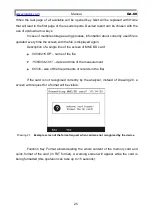
Options
– go to charts setting screen (like the one below):
16


