Manual
GA-60
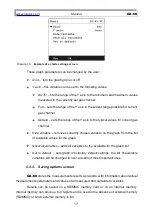
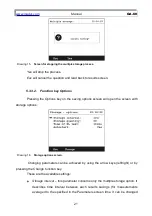
Drawing 10.
Example of a charts settings screen
These graph parameters can be changed by the user:
Grid
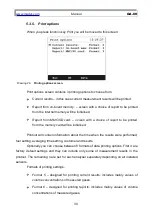
– turn the graph grip on or off
Y axis
– this variable can be set to the following values:
AUTO
– fits the range of the Y axis to the minimum and maximum values
measured in the currently set gas channel.
Full
– sets the range of the Y axis to the widest range possible for current
gas channel.
Default
– sets the range of the Y axis to the typical values for current gas
channel.
Hide variable
– removes currently chosen variable on the graph from the list
of available values for the graph.
Show all variables
– adds all variables to the available for the graph list
Set to default
– sets graph into factory default settings, the list of available
variables will be changed to over a dozen of most important ones.
5.3.3. Saving options screen
GA-60
stores the measurements results as reports, with information about actual
measurements parameters and values of all measured and calculated variables
Results can be saved on a SD/MMC memory card or on an internal memory.
Internal memory can store up to 4 reports and is used in the absence of external memory
(SD/MMC) or when external memory is full.
17


