Changing the Date
1) With the “On” field highlighted press the Enter key. The “On” field
will go into the edit mode.
2) Use the up and down arrows to change the data at the cursor posi-
tion and use the left and right arrows to move the cursor.
3) When you have the date desired, press the Enter key. A pop-up win-
dow will be displayed indicating that the SporTrak Color is calculat-
ing the tides.
Changing the Port
1) With the “At” field highlighted press the Enter key.
2) If you have a MapSend BlueNav Chart loaded, you will be given the
option of selecting internal ports or MapSend BlueNav ports. Use
the up or down arrows to highlight your selection and press the Enter
key.
3) If you selected to use the internal ports, you will be asked to select a
region to search from. Use the up or down arrows to highlight the re-
gion and press the Enter key.
4) Use the keypad to enter the name of the port you want to view tide
information for. When you feel you have entered enough of the
name, you can move the highlight to the “OK” button and press the
Enter key.
5) Use the up or down to select the port you are looking for from the list
of available ports and press the Enter key. A pop-up window will be
displayed indicating that the SporTrak Color is calculating the tides.
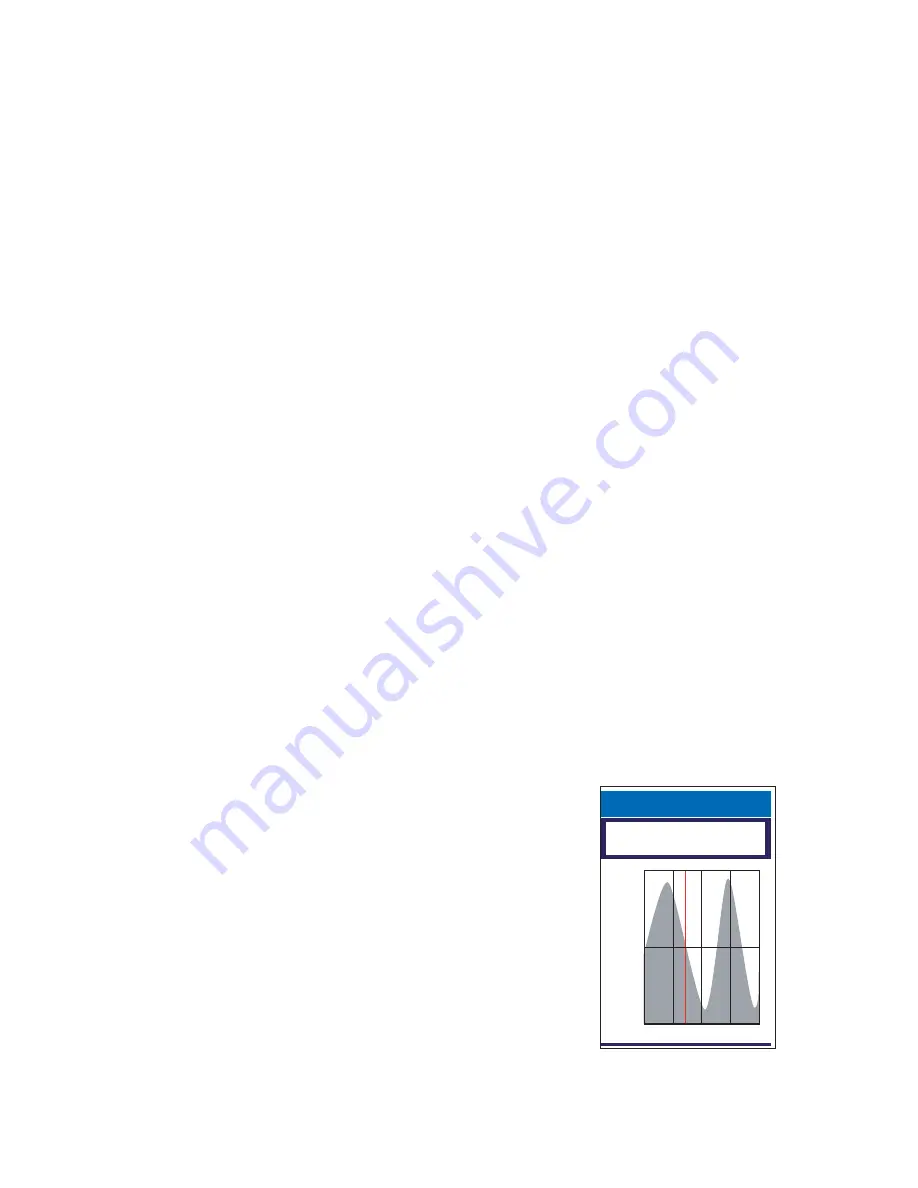
Viewing the Graph
1) Use the up or down arrows to highlight
“Graph” and press the Enter key.
2) The information above the graph displays
time and level of the tide. Use the left or
right arrows to bring up a vertical line that
can be moved along the graph to change the
time for this information. (Note: tide infor-
mation along the graph is available in 15
minute intervals.)
3) To exit the graph display and return to the
main Tide screen, press the Escape key.
0H
6H
12H
18H
24H
16.40
08.20
00.00
Time
Level
09:15
01.77
F
T
F
T
F
T
F
T
Albany


