140
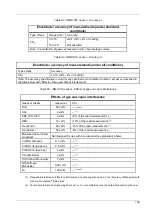
(3) Interference at the indicated gas level. For example, 50 vol% Helium typically decreases the values read in
CO
2
by 6%. This means that if the mixture contains 5.0 vol% CO
2
and 50 vol% Helium, the CO
2
concentration
measurement will normally be calculated as follows:
(1 - 0.06) * 5.0 vol% = 4.7 vol% CO
2
.
According to ISO 80601-2-55.
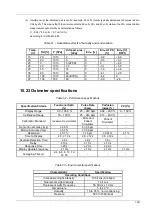
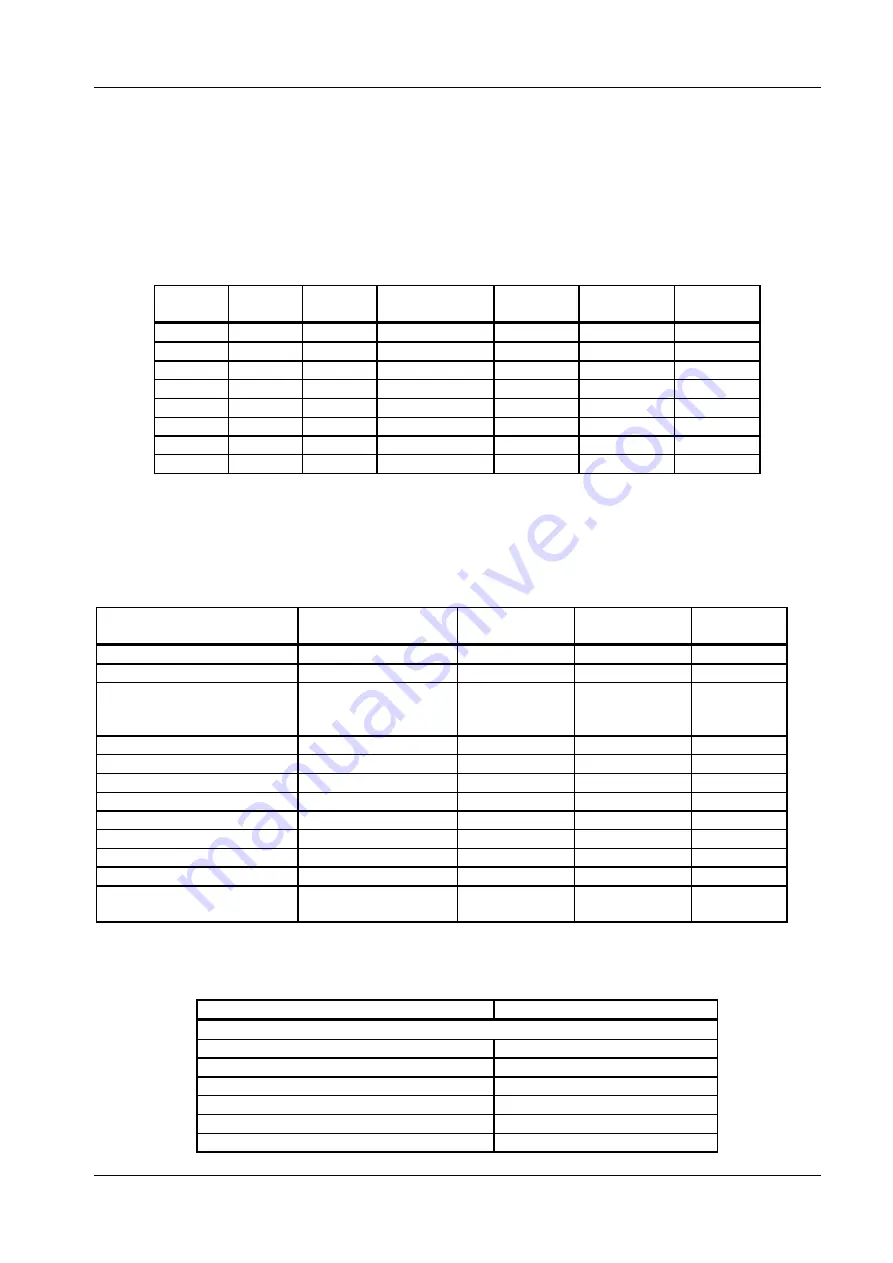
Table 51
– Quantitative effects of humidity and condensation
Temp
[C]
RH [%]
P [hPa]
H
2
O part.pres
[hPa]
Err
rel
[%]
Err
rel
ATPD
[%]
Err
rel
[%]
BTPS
10
20
1013
2
0
-0,2
+6,0
20
20
1013
5
0
-0,5
+5,7
25
0
1013
0 (ATPD)
0
0
+6,2
25
23
1013
7,3
0
-0,7
+5,5
25
50
1013
16
0
-1,6
+4,6
30
80
1013
42
0
-4,1
+2,0
37
100
1013
63 (BTPS)
0
-6,2
0
37
100
700
63
0
-9,0
-2,8
10.23 Oximeter specifications
Table 52
– Performance specifications
Table 53
– Environmental specifications
Specification Criteria
Functional SpO
2
(%)
Pulse Rate
(bpm)
Perfusion
index (%)
PVI (%)
Display Range
0.0 - 100.0 %
25
– 240 bpm
0.02
– 20.0 %
0
– 100 %
Calibration Range
70
– 100 %
25
– 240 bpm
0.10
– 20.0 %
-
Calibration Standard
Invasive Co-oximeter
ECG and
Patient
Simulator
Patient
Simulator
-
No motion accuracy (ms)
≤ 2.0 %
≤ 3.0 bpm
-
-
Motion Accuracy (rms)
≤ 3.0 %
≤ 5.0 bpm
-
-
Resolution
≤ 0.1 %
≤ 1 bpm
≤ 0.01 %
≤ 1 %
Time to Display
≤ 8, ≤ 12 s
≤ 8, ≤ 12 s
≤ 8, ≤ 12 s
-
Asystole Detection Time
≤ 8 s
≤ 8 s
≤ 8 s
-
Delay
≤ 10 s
≤ 10 s
≤ 10 s
-
Response Time
≤ 20 s
≤ 20 s
≤ 20 s
-
Display Update Frequency
≥ 1 Hz
≥ 1 Hz
≥ 1 Hz
≥ 1 Hz
Averaging Time (s)
2-4, 4-6, 8, 10, 12,
14, 16
-
-
-
Characteristic
Specification
Operating Conditions
Incandescent light intensity
100 k Lux (Sunlight)
Fluorescent Light Intensity
10 k Lux
Fluorescent Light Frequency
50, 60 Hz ± 1.0 Hz
Temperature
5 to 40 °C
Humidity
15 to 95 %, non-condensing
Pressure
500 to 1060 mbar


