Data Interpretation
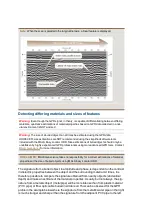
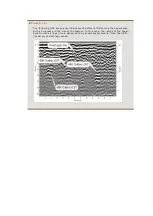
Buried utilities are displayed in the GPR profile as a hyperbola, which is often referred to
as a
signature
1
. The shape, size and intensity of these signatures can help identify the
features that are causing the reflections. The following are examples of data inter-
pretation based on analysis of the hyperbolic reflections.
Hyperbolic Signatures
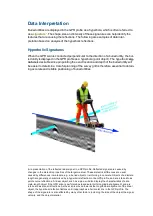
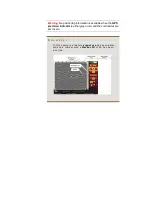
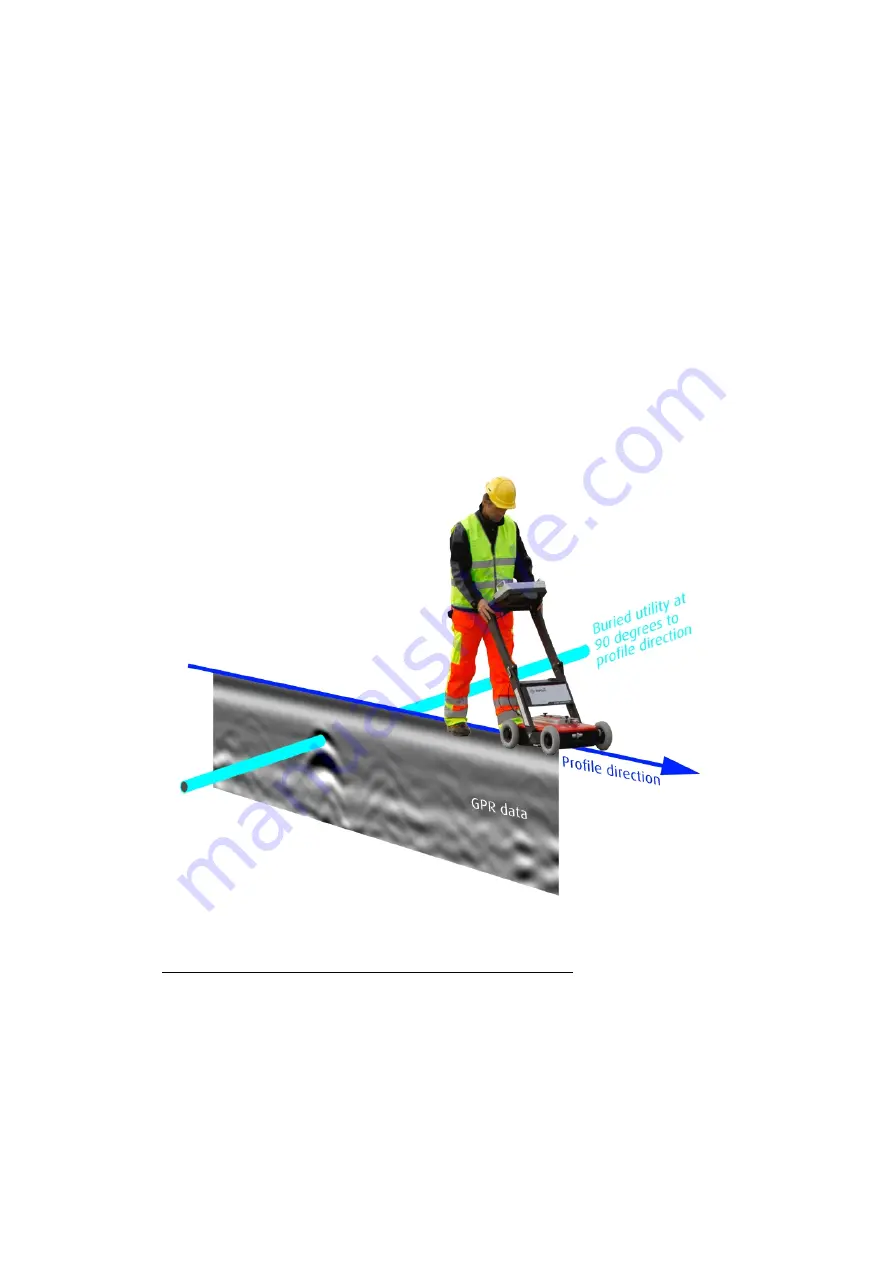
When the GPR scan is conducted perpendicular to the direction of a buried utility, the bur-
ied utility is displayed in the GPR profile as a hyperbola (point object). The hyperbolic
sig-
nature
is desirable since pinpointing the exact location and depth of the buried utility will
be easier to determine. Careful planning of the survey grid is therefore essential to obtain-
ing accurate and reliable positioning of buried utilities
1
A representation of the reflected radar signal in a GPR profile. Reflected signals are caused by
changes in the dielectric properties of the target medium. These dielectric differences are usual
caused by differences in materials, e.g., a buried object or reinforcing in concrete. Objects of a discrete
length are generally characterized by a hyperbolic reflection in the GPR profile, and are referred to as
point source reflections. A linear object, such as a pipe, will also display the characteristics of a dis-
crete-length object if the GPR scan is performed perpendicular to its longitudinal alignment, and are
referred to as planar reflections. As the scan is moved towards the longitudinal alignment of the linear
object, the hyperbolic refection flattens until it approaches a horizontal line in the GPR profile. The
shape of the signature is also affected by many other factors, including the size of the object, the signal
velocity, and the object material.


