SkyRaider DS287 User Manual
August 19, 2018
SkyRaider DS287 User Manual
Page 125
Histogram
A
Histogram
illustrates how pixels in an image
are distributed by graphing the number of
pixels at each color intensity level. The
Histogram
shows detail in the shadows (shown
in the left part of the histogram), mid-tones
(shown in the middle), and highlights (shown in
the right part).
A
Histogram
can help you determine whether
an image has enough detail to make a good
correction.
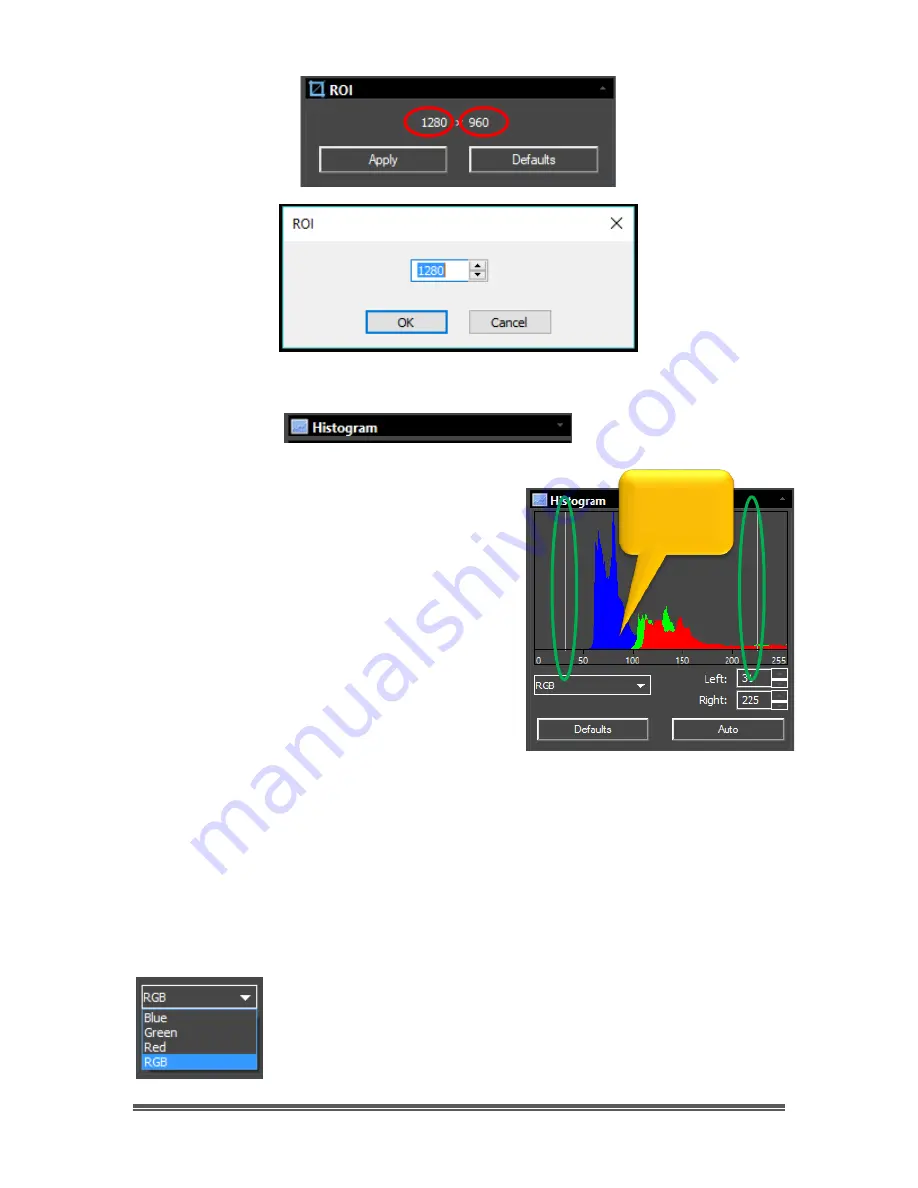
The
Top Window
in the expanded
Histogram
Control shows the Histogram
of current active
video.
Two vertical
line markers
(white) show the
upper
and
lower
limits of the intensity
levels. These markers can be dragged with mouse (
Left-Click-Hold and Drag
), or
you can enter in specific values to place the vertical Line markers.
You use the Histogram to aid you in determining the best exposure value for your
particular object. But try not to get too aggressive, as you can easily clip
(remove) important data form your image.
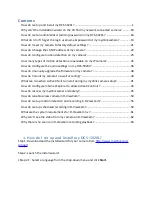
If you are looking at a color image, the
Histogram
will reflect
the
RGB
(
R
ed,
Green
and
Bl
ue channels histogram at the same
time) values with shading of the same color. You can also use
the
Pull-Down
to select the
Histogram
for just the
Red,
or just the
Green
, or just the
Blue
channel.
This is
your Data


