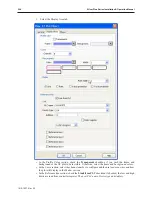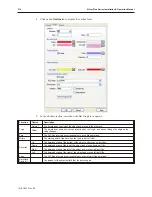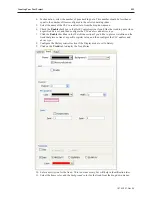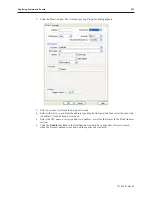
10. Select the
Limits
tab to display the Limits form.
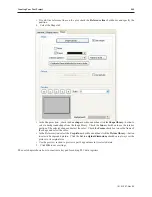
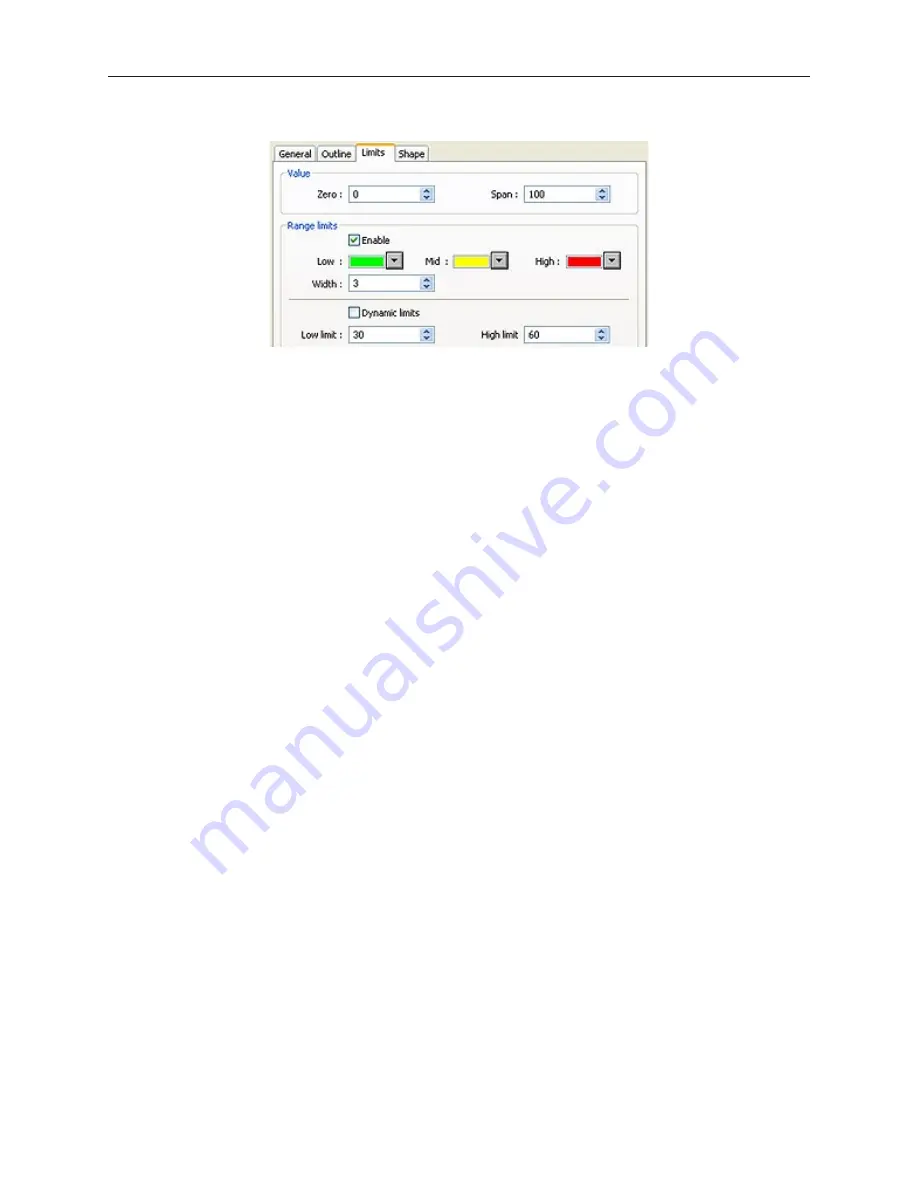
11. In this section, you can configure a scale that goes on the face of the meter that shows by a
color indication when high and low limits have been exceeded. If you look at the example on
the previous page, you will see this is represented on the face of the meter as a red, yellow
and green strip. In the Value section, select the
zero
and
span
.
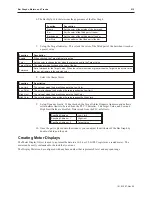
12. In the Range limits section, if you'd like to enable the limits, click the
enable
check box and
then select the
colors
for low, mid and high. Select the
width
, in pixels, of the color band.
The values from 'zero' to low limit will be on te 'low' color band; values from low limit to
high limit will be on the 'mid' color band; values greater than high limit will be on the 'high'
color band.
13. Select the
low limit
and
high limit
. If the limits are dynamic, click the
Dynamic limits
check
box and then configure the PLC addressing that pops up.
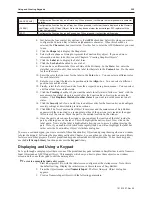
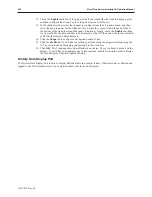
14. If you'd like a background shape to appear with your meter, click the Shape tag and select a
shape.
15. Click
OK
. The meter appears on the work area of EasyBuilder. Click to drag and place your
meter on your work area. If you need to reconfigure any of the properties, you may double
click on the object and the properties dialog box will reappear.
Cre ating Trend Dis plays & Data Sam pling Objects
Data Sampling objects can be used to log historical data. Once data is historically logged, it can be saved to the
OIT's internal memory, or to an external memory source such as CompactFlash, USB or a PC.
The Trend Display Object is used to sample the data in a single or multiple 16-bit PLC registers and plot this data on
a time graph. You can configure the Trend Display as a single page or with multiple pages that can be viewed by
scrolling through the pages. The sampling rate and number of plots per page can be customized per trend graph.
You can display a maximum of 16 channels with varying colors to distinguish the channels. Finally, a hold feature
allows you to ‘freeze’ the graph and/or clear the graph.
In order to create a trend object, you must first create a number of data sampling objects from which to sample the
trends.
1010-1007, Rev 05
218
Sil ver Plus Se ries In stal la tion & Op er a tion Man ual
Summary of Contents for Silver Plus Series
Page 20: ...1010 1007 Rev 05 16 Silver Plus Series Installation Operation Manual ...
Page 31: ...COM Ports for the HMI5056 5070 1010 1007 Rev 05 Connect the OIT to the PLC or Controller 27 ...
Page 38: ...1010 1007 Rev 05 34 Silver Plus Series Installation Operation Manual ...
Page 49: ...7 Click the Shape tab 1010 1007 Rev 05 Creating Your First Project 45 ...
Page 62: ...1010 1007 Rev 05 58 Silver Plus Series Installation Operation Manual ...
Page 75: ...3 Click OK The System Parameter Settings dialog appears 1010 1007 Rev 05 Using EZware 5000 71 ...
Page 132: ...1010 1007 Rev 05 128 Silver Plus Series Installation Operation Manual ...
Page 156: ...1010 1007 Rev 05 152 Silver Plus Series Installation Operation Manual ...
Page 210: ...1010 1007 Rev 05 206 Silver Plus Series Installation Operation Manual ...
Page 216: ...1010 1007 Rev 05 212 Silver Plus Series Installation Operation Manual ...
Page 246: ...1010 1007 Rev 05 242 Silver Plus Series Installation Operation Manual ...

