MBW 473 Manual English V5.0
29
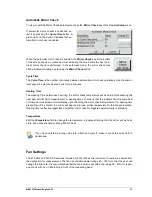
Fixed Range
The Fixed Range mode allows you to select a fixed range
for the graph’s y-axis. It automatically cen-
ters on the most recent data point. As the most recent data varies, so will the center point of the graph,
leaving the overall range fixed. The Fixed Range mode is mostly used to monitor data for stability. For
example, if you set the fixed range for the external temperature graph to 0.2 and the current data is
23.00 °C all data between 22.80 °C and 23.20 °C is visible on the graph.
Minimum/Maximum
In the Minimum/Maximum mode you can specify the minimum and maximum values used for the
graph’s y-axis. Unlike the other modes, the visible range of the graph’s y-axis will not automatically
change if a data point is outside the set minimum/maximum range. If the data points are outside the
specified range, you will not see them on the graph.
Time Span
Time Span determines the number of minutes of the data history that is visible on the graph. The 473
stores a fixed number of data points independent of the selected time span. Thus, changing the time
span will change the time interval at which the data points are stored. The total number of stored data
points will not change. With a time span of 15 (15 minutes), the graph data is sampled and stored
every few seconds. With a time span of 120 (2 hours), the graph data is only sampled, stored, and
updated about once a minute.
When you change the time span, the data that was sampled and stored at the old interval will be in-
crementally replaced by new data sampled at the new interval. The time span indicated on the graph
will always reflect the actual time span of the data that is displayed on the graph, and will agree with
the time span you selected once enough data points have been sampled. The selected time span is
common to all graphs, so they will always have the same time relationship to one another.
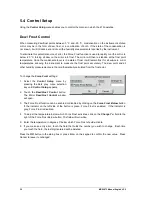
The time span can be changed in the Numeric/Graphic menu:
1. Touch the graph you wish to change on the screen. The Graph Scaling dialog box will appear.
2. Touch the
Change To:
field next to
Time Span
. The field will turn white.
3. Use the numerical keypad to enter an
even
value between 2 and 1440. As you enter the value it
will appear in the white
Change To:
field of the dialog box.
4. If you make an entry error, touch the field that holds the number you wish to change. Each time
you touch the field, the last digit entered will be deleted.
5. Press the OK button in the dialog box or press Enter on the key board to confirm the new value.
Press Cancel to leave it unchanged.
6. The result will take some time to show as the old data at the old time interval will be replaced by
data at the new time interval gradually as determined by your selected time span.
If you prefer to see the same measurement as both numerical value and graph, you may
select the same parameter on two data lines, and set one line to graph mode and the
other to numeric mode. See sections 5.2 and 5.3 for instructions on selecting displayed
parameters and changing their display modes.
Summary of Contents for 473-RP2
Page 1: ...Operation and Maintenance Manual V5 0 Dew Point Mirror 473...
Page 2: ......
Page 4: ...ii MBW 473 Manual English V5 0...
Page 8: ...2 MBW 473 Manual English V5 0...
Page 10: ...4 MBW 473 Manual English V5 0...
Page 14: ...8 MBW 473 Manual English V5 0 SH2 SHX Fan Fan...
Page 30: ...24 MBW 473 Manual English V5 0...
Page 68: ...62 MBW 473 Manual English V5 0...
Page 69: ...MBW 473 Manual English V5 0 63 11 Drawings 11 1 Display Unit Side View...
Page 70: ...64 MBW 473 Manual English V5 0 Front View Back View...
Page 71: ...MBW 473 Manual English V5 0 65 11 2 Measuring Heads RP2 SH2...
Page 72: ...66 MBW 473 Manual English V5 0 SHX SH3...
Page 73: ...MBW 473 Manual English V5 0 67...
Page 74: ...68 MBW 473 Manual English V5 0...

