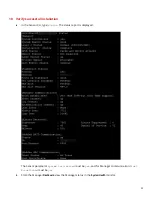
The Manager status displays as
Up
and Sensor status is
Active
.
c
From the Manager, select
Devices
|
<Admin Domain Name>
|
Devices
|
<Device Name>
|
Setup
|
Physical Ports
to
open the ports page.
<Device Name>
indicates the name of the Sensor you added.
d
A policy named Default Prevention is active upon Sensor addition. To view this policy, select
Policy
|
<Admin Domain Name>
|
Intrusion Prevention
|
Policy Types
|
IPS Policies
. Select
Default Prevention
from the list and
click
Edit
.
The
Default Prevention
policy contains attacks already configured with a "blocking" Sensor
response action. If any attack in the policy is triggered, the Sensor automatically blocks the
attack. To tune this or any other McAfee-provided policies, you can clone the policy and then
customize it as described in the McAfee Network Security Platform IPS Administration Guide.
e
Select
Devices
|
<Admin Domain Name>
|
Devices
|
<Device Name>
|
Setup
|
Physical Ports
.
f
Select the port on the Sensor that you cabled to view port settings. Make sure that your port settings
match the cabling, for example, if port 1 is cabled for inline mode, then the mode of operation in the port
setting must be inline mode.
For more information on port settings, see Configuring the monitoring and response ports of a
Sensor chapter in the McAfee Network Security Platform IPS Administration Guide.
11 You're up and running!
Your Sensor is actively monitoring connected segments and communicating with the Manager for
administration and management operations.
a
For detailed usage instructions, see McAfee Network Security Platform IPS Administration Guide, or click
the
?
buttons in the upper-right corner of each window in the Manager.
b
Start the
Analysis
|
<Admin Domain Name>
|
Attack Log
to view alert statistics as attacks are detected. A
summary of alerts is displayed in the
Unacknowledged Alert Summary
monitor of the Manager
Dashboard
page.
12


